Key Takeaways
- Community revitalization is a timing-based pricing inefficiency — not a social initiative. Returns come from entering before demand formation is reflected in asset prices.
- Asset values increase from two sources: income growth from improved operations, and yield compression as risk perception declines. Yield compression is often the larger driver.
- Capital enters revitalizing markets in layers — early (local/entrepreneurial), transitional (family offices, regional operators), then institutional. Each layer compresses returns for those that follow.
- The Decision Framework in this article identifies seven conditions that determine when the revitalization thesis is actionable versus when to step aside.
- Not every revitalization narrative converts into returns. False demand signals, mis-timed entry, and structural constraints (zoning, infrastructure, overcapitalization) are the primary failure modes.
Pricing Inefficiency, Capital Sequencing, and Asset Revaluation
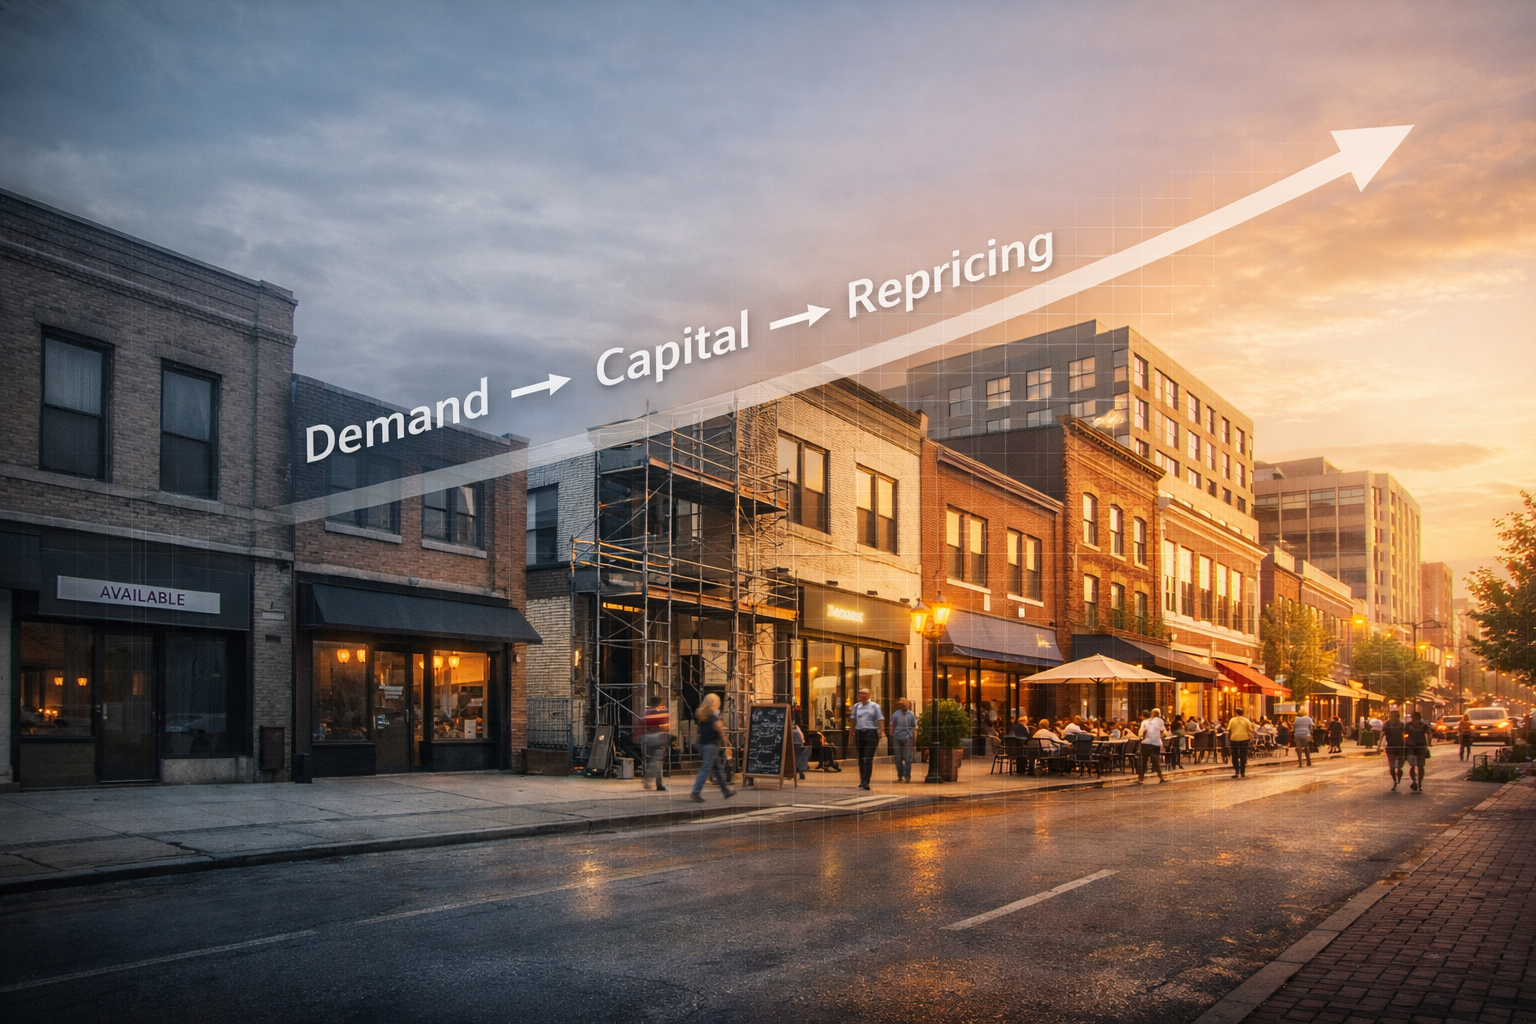
Community revitalization is not simply a social initiative. It can be a way to capitalize on structural pricing inefficiencies that exist because early-stage demand formation is seen as too risky. The investment opportunity arises because the market underprices assets in areas where demand is forming but not yet visible in current income or comparable sales.
Misclassification: Why Revitalization Is Treated as Charity Instead of Strategy
The prevailing error is not a lack of data. It is a categorization mistake.
Investors tend to group community revitalization alongside two adjacent but analytically distinct domains:
- Philanthropic capital deployment
- ESG-aligned allocation strategies
Both frameworks emphasize outcomes external to the asset itself. Returns, if discussed, are treated as secondary or uncertain. This framing implicitly assumes that revitalization is additive to returns at best and dilutive at worst.
That assumption does not hold under scrutiny.
Revitalization is not defined by intent. It is defined by sequence. It occurs at a stage in the capital cycle where:
- Demand is forming but not yet priced
- Capital is selective and often fragmented
- Institutional underwriting frameworks lag observable change
In other words, revitalization sits in the gap between emerging economic reality and recognized asset value.
Labeling this phase as “impact” or “community-focused” obscures the underlying mechanism: early-stage market formation. Markets do not emerge fully priced. They transition through periods where:
- Perceived risk exceeds actual risk
- Capital availability is constrained relative to opportunity
- Pricing generally reflects historical conditions, not forward demand
Investors who interpret revitalization through a moral or signaling lens systematically miss the economic asymmetry embedded in that transition.
This is not a critique of impact-oriented capital. It is a clarification. The return profile is not a byproduct of doing good. It is a function of entering before pricing adjusts.
Revitalization Compared to Adjacent Investment Strategies
Revitalization is often conflated with other strategies that operate in superficially similar environments but rely on different return drivers.
ESG (Environmental, Social, and Governance) investing is typically intent-driven. Capital is allocated based on environmental or social criteria, with financial performance evaluated alongside non-financial outcomes. The underlying assumption is that values alignment may influence long-term returns, but the investment framework does not depend on timing inefficiencies in market formation.
Distressed investing focuses on dislocation, but of a different kind. Assets are impaired due to capital structure stress, operational failure, or cyclical downturns. The opportunity is created by forced selling or restructuring complexity, not by the early emergence of new demand.
Opportunistic real estate strategies may intersect with revitalizing markets, but they are defined by risk tolerance and return targets rather than by a specific phase of market development. They often rely on leverage, redevelopment, or leasing execution across a range of market conditions.
Revitalization differs in that it is not anchored in intent, distress, or mandate. It is a function of timing within a market’s evolution. The opportunity exists because pricing reflects outdated risk perceptions while forward demand is already forming.
Misclassification has practical consequences. Capital is either excluded or mispriced. Institutional investors tend to enter late, once data confirms stability, while early-stage risk is over-penalized relative to actual conditions.
The result is a persistent gap between economic reality and asset pricing.
We read it this way: revitalization is not a capital category. It is a timing-based pricing inefficiency within the broader real estate cycle.
The Investment Thesis: Demand Precedes Pricing, and Pricing Follows Capital
The community revitalization investment thesis, as we frame it, can be stated precisely:
Investing in undercapitalized but demand-forming communities creates asymmetric upside because asset pricing lags both economic activity and capital inflows.
Mechanism:
-
- Early investment supports or anticipates demand formation (residential, commercial, or mixed-use)
- Incremental capital reduces perceived risk and increases liquidity
- Market participants reprice assets as occupancy, income, and transaction volume stabilize
Outcome:
- Above-market appreciation driven by repricing, not just income growth
- Yield compression as risk perception declines
- Multiple expansion on exit due to broader buyer participation
In our assessment, this is not a speculative thesis. The pattern is observable across cycles and geographies — what varies is timing, execution discipline, and capital structure.
The critical distinction is that returns are generated not simply from holding assets, but from positioning within a specific phase of market development.
Decision Framework: When the Revitalization Thesis Is Actionable
The thesis is not universally applicable. It depends on identifying markets where pricing lags observable economic transition, and where that transition is likely to sustain.
The following framework is intended to convert the thesis into a screening tool for capital allocation.
1. Entry Condition: Evidence of Demand Formation (Not Narrative)
Invest when:
-
- Residential occupancy is increasing from previously depressed levels
- Population inflow is observable (even if modest)
- Early-stage commercial activity exists (service retail, local businesses)
Avoid when:
- Demand signals are isolated or episodic
- Activity is driven primarily by announced projects rather than lived usage
- Vacancy remains structurally elevated without directional improvement
2. Pricing Condition: Misalignment Between Perception and Reality
Invest when:
-
- Asset pricing reflects historical decline rather than current trajectory
- Comparable sales lag observable leasing or occupancy trends
- Cap rates embed a risk premium inconsistent with on-the-ground conditions
Avoid when:
- Pricing has already adjusted to reflect forward expectations
- Market narratives are widely disseminated and capital inflows are accelerating
- Yield compression has largely occurred prior to entry
3. Capital Sequencing Position: Early or Transitional Phase
Invest when:
-
- Capital is fragmented, local, or relationship-driven
- Institutional participation is limited or absent
- Financing is available but not yet fully competitive
Avoid when:
- Institutional capital is actively deploying at scale
- Transaction volume is high and price discovery is efficient
- Market entry is driven by momentum rather than underwriting
4. Structural Viability: Ability for Feedback Loops to Sustain
Invest when:
-
- Infrastructure is already in place but underutilized
- Zoning and policy environment permit incremental growth
- Demand drivers (employment access, affordability) are durable
Avoid when:
- Structural constraints (zoning, infrastructure, policy) limit scalability
- Demand depends on a single catalyst or employer
- Growth requires large, coordinated capital rather than incremental activation
5. Execution Feasibility: Asset-Level Alignment with Market Transition
Invest when:
-
- Assets can stabilize with modest capital expenditure
- Layout and location align with emerging tenant demand
- Leasing risk is operational, not structural
Avoid when:
- Assets require heavy redevelopment to achieve market fit
- Tenant demand is speculative rather than observable
- Execution depends on future market conditions rather than current signals
6. Risk Discipline: Timing and Capital Structure Sensitivity
Invest when:
-
- Entry basis allows for extended stabilization timelines
- Leverage is conservative relative to income volatility
- Capital structure can absorb delayed repricing
Avoid when:
- Returns depend on rapid appreciation or cap rate compression
- Leverage magnifies downside in early-stage volatility
- Holding period assumptions are narrow or inflexible
7. Exit Visibility: Presence of a Future Buyer Base
Invest when:
-
- There is a clear path to broader buyer participation
- Comparable markets have transitioned through similar phases
- Exit pricing can reasonably reflect stabilized conditions
Avoid when:
- Exit depends on continued narrative expansion rather than fundamentals
- Buyer pool remains structurally limited
- Liquidity is unlikely to improve within the investment horizon
Summary Decision Rule
The revitalization thesis is most actionable when all three conditions are present simultaneously:
- Demand is forming but not fully priced
- Capital has not yet normalized pricing
- Market structure allows transition to sustain
If any one of these conditions is absent, the return profile shifts from asymmetric to conventional, or deteriorates entirely.
A Structured Model of Value Formation
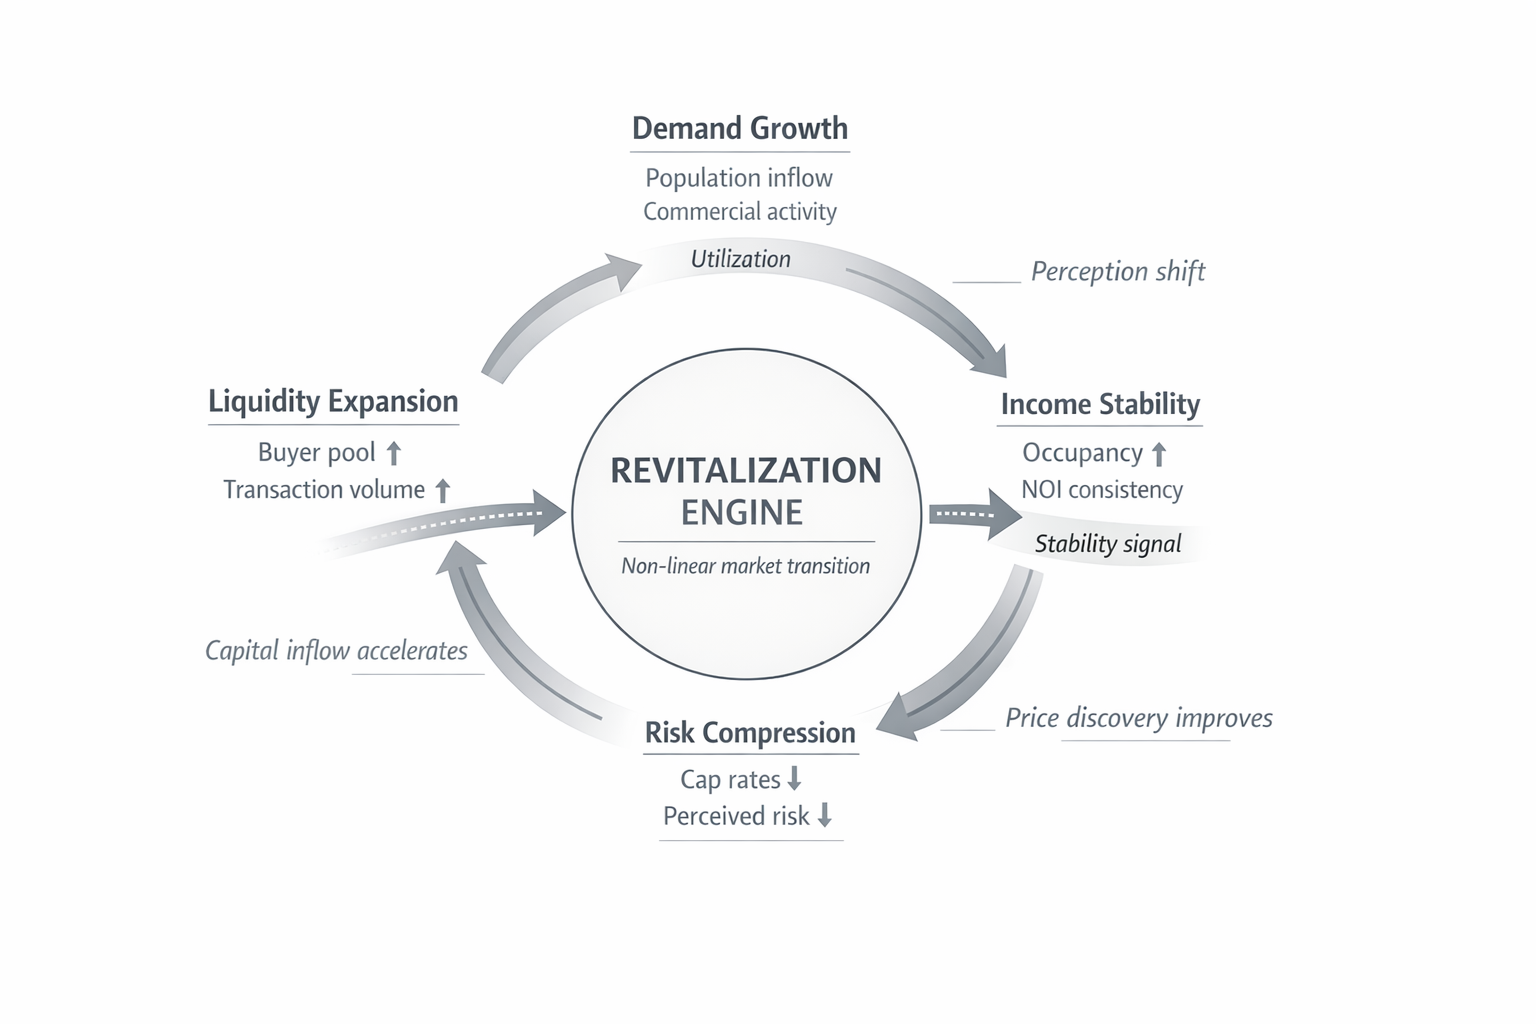
The thesis can be formalized as a function of three interacting variables: demand growth, risk compression, and liquidity expansion.
Demand growth reflects the underlying economic engine. It is observable through population inflows, rising occupancy, and increasing commercial activity. Importantly, it often precedes measurable rent growth, particularly in early-stage markets where pricing has not yet adjusted.
Risk compression follows as uncertainty declines. This is not purely a function of improved fundamentals, but of increased confidence in their persistence. As volatility in income and occupancy stabilizes, required returns begin to decline.
Liquidity expansion occurs as more participants enter the market. Transaction volume increases, financing becomes more accessible, and price discovery improves. Liquidity is both a result of and a contributor to risk compression.
These variables do not move independently. They reinforce one another over time.
Timing asymmetry is central. Entry pricing reflects historical risk—often anchored in outdated data or perception. Exit pricing reflects forward expectations, shaped by observed momentum and increased capital participation.
As a result, returns are driven less by incremental income growth alone and more by the repricing of risk.
This pattern is generally repeatable across markets, though not uniform in timing or magnitude. It is a structural feature of how markets transition from undercapitalized to fully recognized.
The Economic Engine: How Revitalization Produces Financial Returns
Revitalization is not a single event. It is a sequence of reinforcing mechanisms. Understanding these mechanisms is essential because each one contributes to the eventual repricing of assets.
Demand Creation: The Foundational Driver
Revitalization begins with demand, but not in its mature form.
Demand emerges incrementally through overlapping forces:
Stage 1: Population Shifts (Initial Demand Signal)
Population movement is rarely random. It tends to follow affordability gradients and employment access.
In early-stage revitalization areas:
- Housing costs are meaningfully below regional averages
- Proximity to employment centers remains viable
- Infrastructure already exists but is underutilized
- This creates a migration pattern characterized by:
- Renters priced out of primary markets
- Younger households prioritizing cost over established amenities
- Small-scale owner-occupants seeking entry points
The initial population inflow is not large, but it is directionally important. It establishes baseline occupancy and begins to stabilize revenue streams.
Stage 2: Business Formation (Local Economic Activation)
As residential density increases, commercial viability follows.
Early business activity is typically:
- Locally owned
- Service-oriented
- Capital-light
- Examples include:
- Food and beverage
- Personal services
- Small retail
These businesses do not require high foot traffic initially. They rely on proximity and repeat demand.
From an investment perspective, this matters because:
- It diversifies income sources within the community
- It increases perceived livability
- It signals to subsequent investors that the area can support commercial activity
This is not growth in the abstract. It is the gradual conversion of latent demand into observable economic activity.
Stage 3: Consumption Expansion (Demand Reinforcement)
Consumption follows both population and business formation.
The shift is not only in volume but in composition:
- Higher frequency of local spending
- Reduced leakage to adjacent markets
- Increased willingness to pay for convenience
- This has second-order effects:
- Improved unit economics for businesses
- Higher rents justified by stronger sales
- Increased tax revenue, which can support infrastructure improvements
The key point is that demand creation is cumulative. Each incremental change increases the probability of subsequent changes.
Markets do not wait for full transformation. They respond to directional signals.
Feedback Loops, Thresholds, and Non-Linear Acceleration
Once consumption expands, the system begins to exhibit reinforcing feedback loops. Population growth supports business formation, which increases service density, which in turn improves resident retention. Each element strengthens the others.
These loops are not linear. Early changes may appear incremental, but they can reach thresholds where new categories of activity become viable. For example, a critical mass of residents may support higher-quality retail, healthcare services, or institutional tenants that were previously infeasible.
At these thresholds, capital perception shifts more quickly than underlying fundamentals alone would suggest. This is partly driven by signal amplification. Small but visible changes—a well-trafficked restaurant, a renovated streetscape, a new anchor tenant—can disproportionately influence how external investors interpret the market.
However, early-stage systems remain fragile. Demand can stall, businesses can fail, and capital can withdraw if momentum is not sustained. The feedback loops require continuity.
When they hold, the transition tends to accelerate. Revitalization does not progress in a straight line; it moves through phases where change compounds and becomes more legible to outside capital.
Shoora Capital
We invest alongside sponsors who understand market timing — targeting the transition phase where pricing reflects legacy risk, not forward demand. If you are evaluating where specific markets sit within this cycle, we can work through the framework with you directly.
Discuss a Specific OpportunityCapital Follows Momentum: The Sequencing of Investment
Capital does not enter all at once. It arrives in layers, each with distinct characteristics.
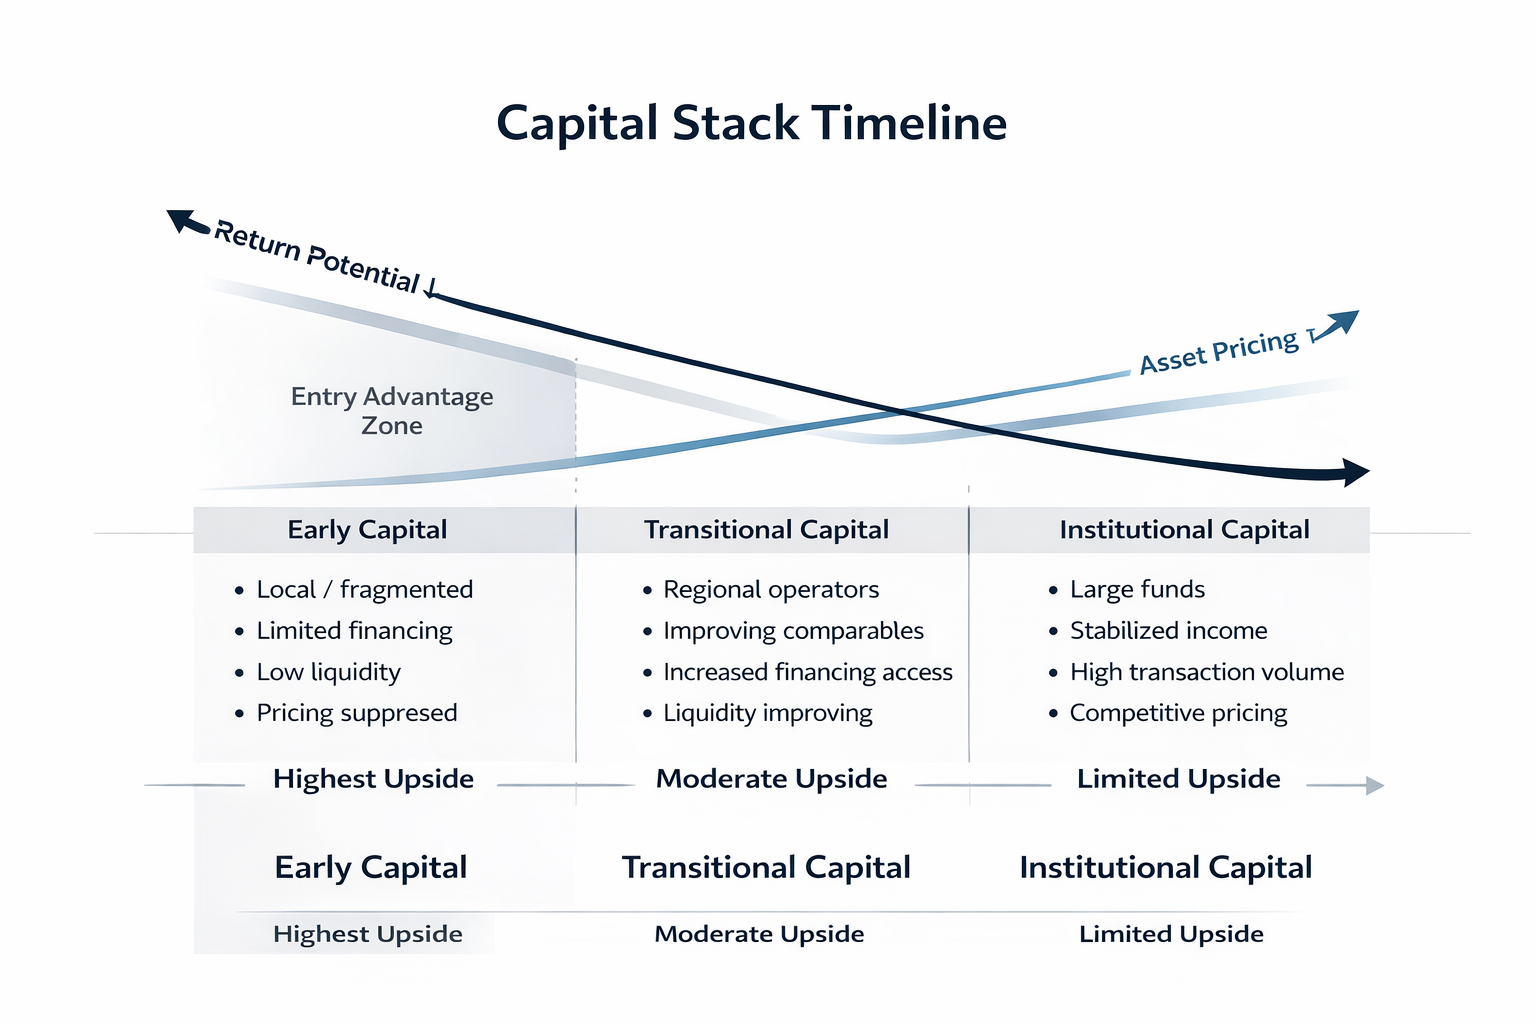
Early Capital: Fragmented and Undercompensated
The first capital into revitalizing communities is often:
- Local
- Entrepreneurial
- Structurally flexible
- It operates without the benefit of:
- Deep liquidity
- Institutional validation
- Established comparables
- As a result:
- Pricing remains suppressed
- Financing is more expensive or limited
- Execution risk is higher
However, this capital also captures the largest potential upside because it enters before the market recognizes the shift.
Transitional Capital: Pattern Recognition
As observable metrics improve—occupancy, rent stability, transaction volume—capital becomes more systematic.
This phase includes:
- Regional operators
- Smaller private equity groups
- Family offices
- Characteristics:
- More structured underwriting
- Increased access to financing
- Willingness to accept moderate execution risk
- At this stage:
- Pricing begins to move
- Comparable sales become more reliable
- Liquidity improves
Importantly, returns begin to compress relative to early entrants, but remain attractive due to continued repricing potential.
Institutional Capital: Validation and Compression
Institutional capital typically enters last.
Its requirements include:
- Stable income streams
- Sufficient transaction volume
- Established market data
- Once these conditions are met:
- Capital availability increases significantly
- Cap rates compress
- Competition intensifies
- This phase often coincides with:
- Large-scale development
- Infrastructure investment
- Broader market recognition
- By this point, the majority of the repricing has occurred.
In our reading, institutional capital does not create the opportunity. It validates and prices it.
Asset Repricing: Where Returns Are Realized
The culmination of demand creation and capital inflow is asset repricing.
This occurs through several channels:
Translating Repricing into Financial Outcomes
At entry, assets in revitalizing markets typically exhibit a combination of high capitalization rates (cap rates), inconsistent occupancy, and limited comparable transactions. Pricing reflects uncertainty more than stabilized income potential.
Consider a simplified progression. An investor acquires an asset at a high going-in yield due to vacancy and perceived location risk. Over time, occupancy stabilizes and rents increase modestly. On a standalone basis, this income growth may appear incremental.
However, the more significant shift occurs in the market’s required return. As transaction volume increases and comparable assets begin to trade at lower cap rates, the same income stream is capitalized more aggressively.
The interaction is multiplicative. Modest net operating income growth combined with cap rate compression can produce disproportionate increases in asset value.
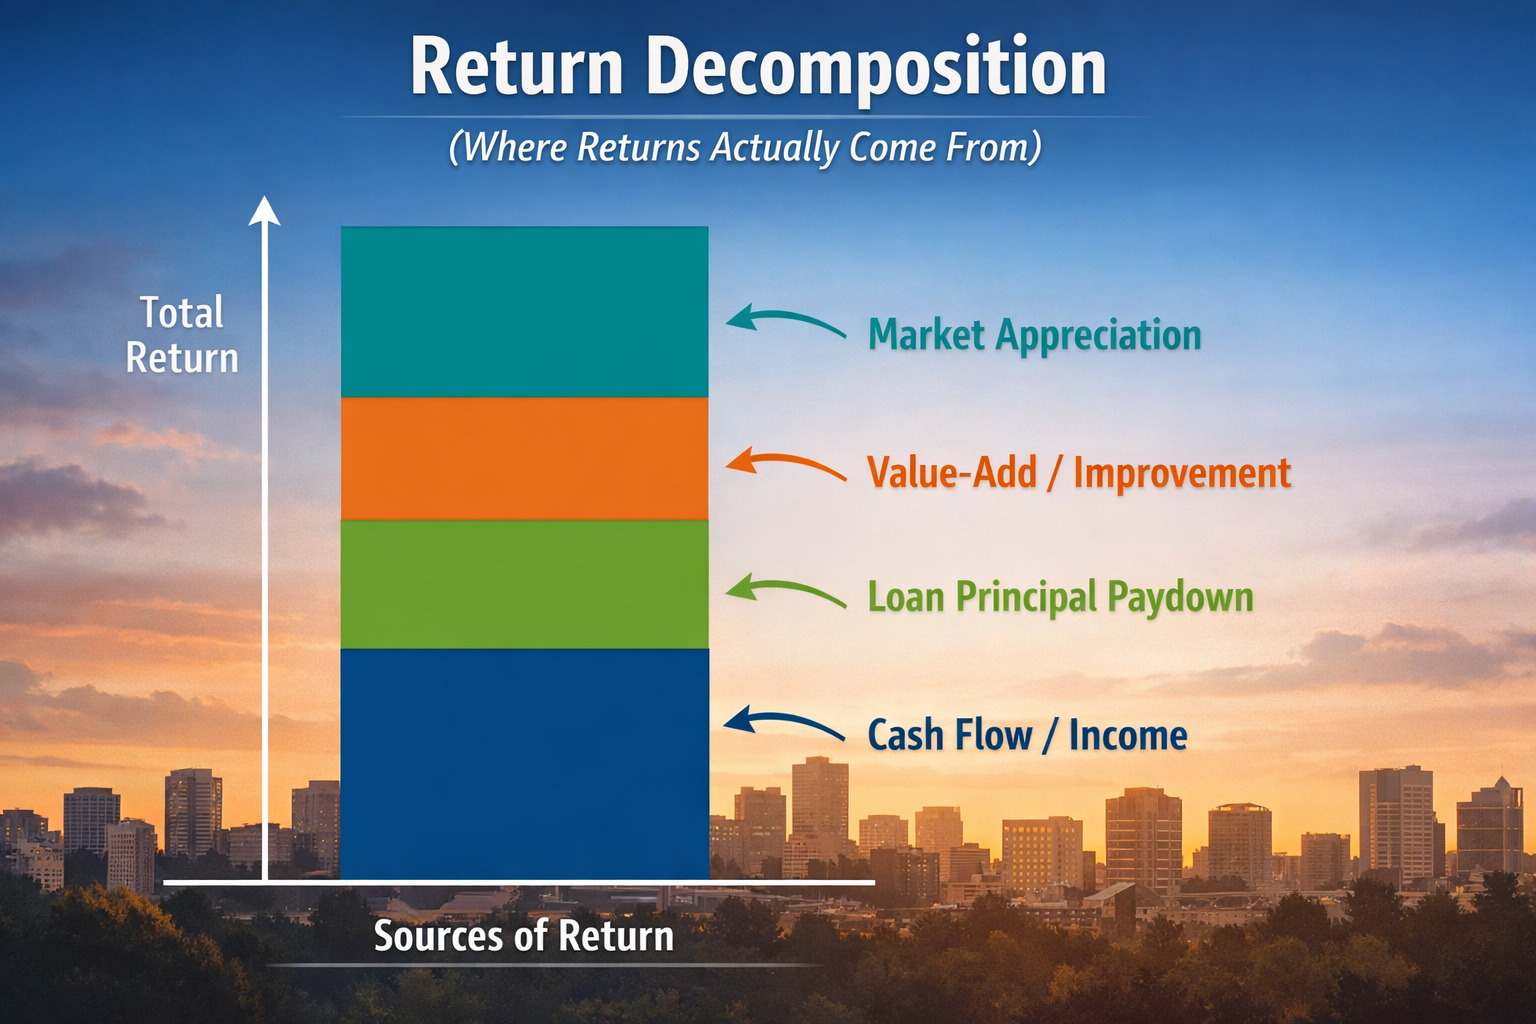
Returns can be decomposed into three layers:
- Income growth from improved leasing and operations
- Yield compression as perceived risk declines
- A liquidity premium as the buyer pool expands
Repricing is fundamentally a reclassification of risk. The asset does not become valuable solely because income increases. It becomes more valuable because the market assigns a different level of certainty to that income.
Real Estate Appreciation
Property values increase as:
- Net operating income rises
- Vacancy declines
- Market comparables adjust upward
- However, appreciation is not purely income-driven. It is also perception-driven.
- As the market assigns lower risk to the area:
- Required returns decrease
- Buyers are willing to pay more for the same income stream
- This is the essence of repricing.
Yield Compression
Yield compression reflects a change in perceived risk.
In early-stage markets:
- Investors demand higher yields to compensate for uncertainty
- Exit liquidity is limited
- As the market stabilizes:
- Risk premiums decline
- Financing becomes more accessible
- Buyer pools expand
- This leads to:
- Lower cap rates
- Higher asset values for the same income
Yield compression is often the largest contributor to outsized returns in revitalization strategies.
Liquidity Expansion
Liquidity is a function of participation.
As more investors recognize the market:
- Transaction volume increases
- Price discovery improves
- Exit options expand
- Liquidity reduces friction in both entry and exit.
- This matters because:
- It allows investors to realize gains more efficiently
- It supports more aggressive underwriting by subsequent buyers
Repricing is not a single event. It is a process driven by successive layers of validation.
Why Revitalization Produces Outsized Returns
Our view is that the return profile associated with community revitalization is not accidental. It is the result of persistent, structural market inefficiencies — not narrative or timing luck.
Information Lag
Data in emerging markets is inherently backward-looking.
Comparable sales reflect prior conditions
Appraisals rely on limited transactions
Institutional models require historical stability
This creates a gap between:
- Real-time economic activity
- Reported market data
Investors who rely exclusively on formal data sources tend to underwrite these markets conservatively or avoid them entirely.
This lag allows informed operators to act on leading indicators rather than confirmed trends.
Behavioral Bias
Investor behavior reinforces the inefficiency.
Common biases include:
- Recency bias: overweighting past decline
- Reputation bias: associating areas with outdated perceptions
- Complexity aversion: avoiding markets that require granular analysis
These biases lead to systematic underallocation of capital to revitalizing areas, even when fundamentals are improving.
Markets do not price fundamentals alone. They price perception.
Capital Allocation Gaps
Large pools of capital face structural constraints:
- Minimum deal sizes
- Liquidity requirements
- Mandate limitations
These constraints make early-stage revitalization markets difficult to access at scale.
As a result:
- Smaller investors dominate early phases
- Capital supply is insufficient relative to opportunity
- Pricing remains inefficient longer than in more liquid markets
This is not a temporary condition. It is a structural feature of how capital is organized.
Underwriting Framework Limitations
Traditional underwriting relies on:
- Stabilized income
- Comparable transactions
- Predictable expense structures
- Revitalization markets often lack these inputs.
- This leads to:
- Higher discount rates
- Conservative assumptions
- Missed opportunities
Investors who can underwrite based on forward-looking indicators—population trends, business formation, infrastructure investment—gain an advantage.
However, this requires discipline. Not all emerging markets transition successfully. Selectivity remains critical.
Position Within the Deal Lifecycle: Where Value Is Created
Revitalization is not an overlay applied to an investment. It is the phase in which value is created.
At entry:
- Assets are priced based on historical conditions
- Income may be below potential
- Perceived risk is elevated
- During execution:
- Demand increases
- Income stabilizes and grows
- Market perception shifts
- At exit:
- Pricing reflects stabilized conditions
- Cap rates compress
- Buyer pools expand
- The distinction is important.
Returns are often attributed to exit timing or market cycles. In revitalization strategies, the primary driver is the transition between entry conditions and stabilized market recognition.
This aligns directly with the framework outlined in our investment philosophy on private real estate, where value creation is tied to mispriced risk rather than passive market exposure.
Similarly, understanding how revitalization fits into acquisition, execution, and disposition phases requires a lifecycle view. The mechanics are explored in more detail in our analysis of the real estate capital stack, but the central point remains: the majority of return is embedded at entry, not engineered at exit.
Failure Modes and Constraints in Revitalization Strategies
The presence of a structural inefficiency does not ensure that any given market will transition successfully. Several failure modes recur with enough frequency to warrant explicit consideration.
First, false demand signals. Early indicators—such as limited population inflow or isolated business openings—may not represent durable trends. Without sustained demand, the feedback loops necessary for revitalization fail to establish.
Second, mis-timed capital entry. Entering too early can result in extended holding periods with limited income growth, while entering too late compresses returns as pricing has already adjusted. Timing risk is distinct from selection risk, though the two often interact.
Third, structural constraints. Zoning restrictions, infrastructure limitations, or adverse policy environments can inhibit development regardless of underlying demand. These factors can cap upside or delay transition beyond acceptable investment horizons.
Overcapitalization presents an additional risk. If capital enters too quickly relative to demand, new supply can outpace absorption, suppressing rents and prolonging stabilization.
Not all revitalization narratives convert into investable outcomes. The thesis is directionally valid, but it is contingent on market-specific execution, sequencing, and constraint analysis.
Investor Implications: How to Apply the Thesis
The community revitalization investment thesis is not universally applicable. It requires a specific approach to both market selection and execution.
Market Selection Criteria
Investors should prioritize markets where:
- There is evidence of early demand formation
- Infrastructure exists but is underutilized
- Pricing reflects historical decline rather than current trajectory
- Indicators may include:
- Increasing occupancy in residential assets
- Early-stage commercial activity
- Public or private investment in infrastructure
These signals do not guarantee success. They increase the probability of transition.
Asset-Level Considerations
Within selected markets, asset characteristics matter.
Favorable attributes include:
- Functional layouts that require limited structural changes
- Locations with proximity to emerging commercial nodes
- Flexibility in tenant mix
Assets that require extensive repositioning introduce additional risk that may not be compensated by pricing.
Capital Structure Discipline
Leverage can amplify returns, but it also increases vulnerability during transitional phases.
Investors should consider:
- Conservative leverage at entry
- Flexibility in financing terms
- Sufficient reserves for execution risk
Revitalization timelines are not linear. Capital structures must accommodate variability.
Execution Capability
The thesis depends on more than market selection.
Execution includes:
- Property management aligned with evolving tenant profiles
- Incremental capital improvements tied to demand
- Active leasing strategies
- Passive ownership is unlikely to capture the full benefit of market transition.
Exit Strategy Awareness
Exit conditions should be considered at entry.
Investors should evaluate:
- Likely buyer profiles at stabilization
- Comparable markets that have completed similar transitions
- Sensitivity to cap rate changes
- Exit is not an afterthought. It is the realization of the repricing thesis.
Closing: Selective Exposure to Mispriced Transition
Community revitalization is best understood as a phase where markets transition from underrecognized to fully priced.
It is not uniformly attractive. It is not risk-free. It is not driven by narrative.
It is driven by:
- Demand formation ahead of recognition
- Capital inflows that validate and accelerate change
- Asset repricing that reflects reduced uncertainty
For investors willing to operate within that transition—accepting variability, underwriting forward conditions, and executing with discipline—the return profile can be meaningfully different from stabilized market strategies.
Opportunities are inherently local and require detailed analysis. Broad generalizations tend to obscure more than they reveal.
Frequently Asked Questions
Is community revitalization investing the same as impact investing?
No. Revitalization investing is defined by timing within the capital cycle — entering when demand is forming but not yet reflected in asset pricing. Impact investing is intent-driven and evaluates non-financial outcomes alongside returns. The return mechanisms are structurally distinct, even when they operate in overlapping geographies.
What are the biggest risks in revitalization strategies?
The primary failure modes are: false demand signals that don’t represent durable trends; mis-timed entry — too early means extended holding with limited income growth, too late means pricing has already adjusted; structural constraints including zoning, infrastructure, or policy limitations; and overcapitalization, where new supply outpaces demand absorption.
When should an investor avoid a revitalization market?
When pricing has already adjusted to reflect forward expectations, when institutional capital is actively deploying at scale, when market narratives are widely disseminated, or when demand signals are isolated rather than directionally sustained. The return profile shifts from asymmetric to conventional — or deteriorates — when these conditions apply.
How does the return profile of revitalization strategies differ from stabilized real estate?
Stabilized strategies primarily generate returns through income growth and dividend yield. Revitalization strategies add a second return layer: yield compression as risk perception declines and the buyer pool expands. This repricing component is often the larger driver of total return in successful revitalization investments.
What role do family offices play in the capital sequencing of revitalization markets?
Family offices typically represent the transitional capital layer — entering after early observable metrics improve (occupancy, rent stability, transaction volume) but before institutional capital normalizes the market. They accept moderate execution risk in exchange for continued repricing potential, and their participation is often a leading indicator that a market is transitioning toward institutional recognition.