Why Shoora Prefers Direct Operator Oversight vs. Third-Party Fund Models

real estate investor in hard hat giving direct oversight

Key Takeaways

  • The choice between direct oversight and a fund structure is a governance question — where authority, accountability, and decision rights reside.
  • Fee layering in fund-of-funds structures compounds against net returns; each additional tier reduces the base on which future compounding occurs.
  • Incentive misalignment between managers, fund vehicles, and allocators tends to surface most clearly under stress — not in stable markets.
  • Clarity of decision authority reduces ambiguity when assumptions fail; direct oversight concentrates that authority where accountability sits.
  • Governance is only meaningful if it is observable — documentation of credit parameters, IC approvals, and modification policies is the operational test.

Direct Oversight vs Fund Models: Why Decision Structure Matters

Institutional capital often focuses on manager selection, track record dispersion, and access. Those variables matter. But before evaluating managers, allocators confront a more structural question: what decision architecture governs their capital?

The comparison between direct oversight vs fund model is not primarily about performance marketing or access to deals. It is about where authority sits, how incentives compound, and how governance functions under stress.

This article evaluates the structural distinction across three lenses:

  • Fee drag
  • Incentive alignment
  • Control and underwriting governance

The objective is not to critique fund models. Many operate responsibly and with integrity. The objective is to clarify how structure shapes outcomes, particularly when conditions deviate from base-case expectations.

Direct Oversight vs. Fund-of-Funds: Key Structural Differences

Dimension Direct Oversight Fund-of-Funds / Third-Party
Fee structure Single management layer; transparent costs Multiple tiers at vehicle and manager level
Governance authority Centralized; decision rights held by capital provider Distributed; authority resides with underlying managers
Underwriting control Credit box set and monitored at governing level Underwriting delegated to individual fund managers
Alignment under stress Single accountability chain; incentives are direct Manager, fund, and allocator incentives may diverge
Reporting transparency Cost attribution traceable to asset level Attribution complexity increases across tiers
Best for Allocators prioritizing governance clarity and accountability Allocators prioritizing diversification, access, or specialization

The Real Question Is Not “Which Fund Is Better?” — It Is “Where Does Control Live?”

Before comparing structures, definitions are necessary.

Direct Oversight Model

A direct oversight model is one in which the capital provider retains structural authority over underwriting standards, capital deployment decisions, and portfolio governance. Investment teams execute within a clearly defined mandate, but ultimate decision rights and policy frameworks remain centralized and transparent.

In this structure:

  • Underwriting criteria are established and monitored at the top level.
  • Sponsor selection and credit box parameters are explicitly defined.

Extension decisions, workouts, and restructuring policies follow documented governance protocols.

Fee arrangements are typically singular rather than layered.

The key characteristic is that discretion and governance sit close to capital.

Fund-of-Funds and Third-Party Fund Structures

A fund-of-funds structure allocates capital to underlying third-party managers. Capital flows through at least one intermediary vehicle before reaching the operating investment layer.

In this architecture:

  • The allocator selects managers rather than individual investments.
  • Underwriting authority resides with underlying managers.
  • Performance and management fees may exist at multiple tiers.

Governance is indirect, often exercised through LP (limited partners) advisory committees rather than investment-level decision rights.

Again, this is not inherently inferior. It may offer diversification, specialization, and access benefits. The structural distinction is simply that control is distributed.

The question becomes: how does that distribution affect economics, incentives, and decision-making?

Lens #1 — Fee Drag: Why Layering Compounds Against the Allocator

Fees are not merely a line item. They are a structural input into compounding.

Management Fee Layering

In a direct oversight structure, there is typically a single management layer. Administrative expenses and operating costs are transparent within that structure.

In a fund-of-funds structure, management fees can exist at:

  • The top-level vehicle
  • Each underlying manager
  • In some cases, operating-level asset management entities

Even if each layer appears reasonable in isolation, fee layering in private funds can compound against net returns over time.

A simplified way to think about it:

  • A 1%–2% management fee at multiple tiers does not simply add.
  • It reduces the base upon which future compounding occurs.

This matters more in moderate return environments. In high-return vintages, fee drag may be partially obscured. In lower-return or volatile markets, layering becomes more visible.

Performance Fee Layering

Performance fees introduce another layer of structural compounding.

If an allocator pays:

  • A carry or incentive fee at the underlying manager level, and
  • A performance-based fee at the fund-of-funds level,

The effective share of upside retained by the allocator may be meaningfully reduced.

This does not imply that performance fees are inappropriate. Incentive alignment can be valuable. But layering alters the distribution of gains.

Importantly, the impact of layered performance fees becomes more pronounced when:

  • Gross returns compress
  • Volatility increases
  • Recovery periods extend
  • Under those conditions, net return dispersion widens.

Embedded Cost Opacity

Layered structures can also introduce reporting complexity:

  • Underlying expense allocations
  • Monitoring fees
  • Transaction-level costs
  • Financing spreads

These costs may be disclosed, but attribution becomes less intuitive when capital flows through multiple entities.

From a governance standpoint, our view is that fee drag is not only about percentage points — it is about visibility and compounding arithmetic.

Lens #2 — Incentive Alignment: Discretion and Risk Under Stress

Alignment is frequently discussed in general terms. Structurally, it relates to how discretion is exercised and who bears the consequences of that discretion.

Incentives in Layered Structures

In a multi-tiered structure:

  • The underlying manager is incentivized based on their fund’s performance.
  • The top-level vehicle is incentivized based on aggregate portfolio outcomes.
  • The allocator ultimately bears economic exposure.
  • These incentives can align. But they are not identical.
  • For example:
  • An underlying manager may prioritize protecting their fund-level IRR metrics.
  • A fund-of-funds manager may prioritize smoothing volatility across managers.
  • An allocator may prioritize capital preservation over interim marks.
  • These distinctions tend to surface most clearly in downturns.

Discretion in Down Markets

When markets contract, decision pressure increases:

  • Extend or enforce?
  • Inject rescue capital or preserve dry powder?
  • Mark conservatively or defend prior valuations?

In layered structures, discretion is exercised at multiple levels. The allocator’s influence may be advisory rather than directive.

In direct oversight structures, governance authority over these decisions tends to be centralized. That does not eliminate risk. It clarifies who holds responsibility.

The issue is not whether one model performs better in downturns. It is whether incentive misalignment in funds can emerge when objectives diverge under stress.

Alignment as Governance Principle

In our view, alignment should be approached less as a marketing claim and more as an institutional design question:

  • Who controls underwriting authority?
  • Who controls modifications?
  • Who absorbs downside first?
  • Who determines exit timing?
  • In a well-designed structure, these answers are explicit.

When they are implicit or diffused, allocators rely more heavily on trust and reputation.

Both may be valid approaches. But they differ in governance clarity.

Shoora Capital

Talk to us about which structure fits your portfolio.

Shoora deploys capital with direct oversight into middle market real estate — where governance clarity and operator alignment are built into the structure from day one.

Get in touch →

Lens #3 — Control: Underwriting, Decision Rights, and Governance

The most substantive distinction between direct oversight vs fund model often lies in underwriting control.

Underwriting is not merely deal selection. It includes:

  • Credit box definition
  • Sponsor eligibility criteria
  • Leverage thresholds
  • Geographic concentration limits
  • Duration parameters
  • Extension policies
  • Workout authority

Where Decision Rights Sit

In a fund-of-funds structure:

  • Underwriting authority resides primarily with underlying managers.

The top-level vehicle conducts due diligence but does not typically control asset-level decisions.

Advisory rights may exist but are rarely unilateral.

In a direct oversight structure:

  • The governing entity establishes and monitors underwriting parameters.
  • Investment committees retain authority over capital deployment.
  • Modifications and workouts follow defined policy processes.
  • The distinction is one of decision rights, not competence.

Governance of Underwriting

Underwriting governance matters most when assumptions fail.

For example:

  • If interest rates rise faster than modeled,
  • If liquidity tightens,
  • If sponsor equity erodes,
  • Who decides whether to extend, restructure, or enforce?
  • Clarity of decision authority reduces ambiguity during stress.

Consider a scenario where interest rates rise 250 basis points, exit timelines extend 18 months, and sponsor liquidity deteriorates. In a layered structure, the allocator’s influence over extension decisions may be indirect. In a direct oversight structure, underwriting authority can reassess leverage thresholds, covenant tolerance, and capital reserves within a centralized governance framework.

The discipline required to define those parameters in advance is discussed separately in Shoora’s framework on underwriting governance and execution integrity — see our direct vs. fund comparison. The structural question addressed here is who ultimately holds that rigor accountable.

Transparency in decision authority often correlates with faster response times and fewer internal conflicts during adverse conditions.

A Practical Allocator Framework: Questions to Ask Before Choosing a Structure

Rather than prescribing a preferred model, allocators may benefit from a structured evaluation process.

The following checklist can serve as a reusable allocator decision framework.

1. Where Does Discretion Sit?

Who approves new investments?

Who has authority to override underwriting recommendations?

Who controls capital calls and extensions?

Discretion concentrated in one entity differs from discretion distributed across tiers.

2. How Are Conflicts Resolved?

What formal mechanisms exist for dispute resolution?

Are LP advisory committees advisory or binding?

How are related-party transactions handled?

Conflict resolution protocols are rarely tested in strong markets. They matter in contractions.

3. What Reporting Transparency Exists?

Can capital be traced to the asset level?

Are expense allocations clearly delineated?

Is performance attribution segmented by strategy and decision cohort?

Transparency influences the allocator’s ability to diagnose performance drivers.

4. Who Owns Underwriting Authority?

Is underwriting centralized or delegated?

Are credit parameters documented?

Are deviations from policy recorded?

Ownership of underwriting authority defines accountability.

5. How Is Performance Attribution Tracked?

Are returns segmented by manager, strategy, and vintage?

Can fee impact be isolated?

Is net performance reconciled across tiers?

Layered structures make attribution more complex. That does not make them inappropriate. It makes analysis more necessary.

These questions do not produce a binary answer. They clarify trade-offs.

Structure Selection Framework

Choose direct oversight if…

  • Governance clarity and accountability are a priority
  • You require visibility into asset-level decisions
  • Incentive alignment under stress is a primary concern
  • Fee transparency and single-tier cost structure matter

Consider fund model if…

  • Diversification across managers or strategies is the goal
  • Access to specialized or niche managers is valued
  • Manager selection is preferable to direct underwriting oversight
  • Portfolio construction across strategies outweighs governance concentration

Why Shoora Chooses Direct Oversight

Shoora’s preference for direct oversight is a governance philosophy rather than a market critique.

The view is structural:

  • Control is a form of risk management.
  • Alignment contributes to durability.
  • Transparency is not optional; it is structural.

In Shoora’s framework, concentrating underwriting authority and decision rights within a defined governance structure reduces ambiguity about responsibility. It does not eliminate risk. It narrows interpretive gaps when risk materializes.

In practice, that means every transaction is unanimously approved by a three-person Investment Committee, underwritten to a minimum 1.25x DSCR, with individual LTV capped at 75%, and personal guarantees plus borrower co-investment required on every deal.

This philosophy is outlined in greater detail within Shoora’s investment approach. The emphasis is on structural clarity rather than structural complexity.

There are environments where diversified fund exposure may be appropriate. There are others where tighter governance may be prioritized.

Shoora’s position is that governance architecture should be explicit, documented, and internally coherent.

From Structure to Documentation: How Governance Becomes Visible

Governance is only meaningful if it is observable.

An investment governance structure must translate into:

  • Written credit parameters
  • Documented committee approvals
  • Recorded dissent or conditional approvals
  • Defined authority thresholds
  • Transparent modification policies
  • Without documentation, governance becomes narrative.

The practical manifestation of governance is the investment committee memorandum.

An IC memo is not marketing material. It is an accountability instrument. It clarifies:

  • Assumptions
  • Sensitivity analysis
  • Risk flags
  • Decision rationale
  • Conditional approvals

When allocators evaluate managers or structures, reviewing how decisions are documented often reveals more than reviewing return summaries.

For a structural example of how decision-making is documented and made transparent, our capital stack framework.

If you are evaluating managers or structures, examine how governance is documented and how decision rights are defined.

In Shoora’s view, structure determines incentives. Documentation reveals whether those incentives are operationalized.

Frequently Asked Questions

What is the difference between direct oversight and a fund-of-funds structure?

A direct oversight structure is one in which the capital provider retains authority over underwriting standards, capital deployment decisions, and portfolio governance. Investment teams or operating partners may execute transactions, but investment criteria, leverage parameters, and portfolio decisions are established within a centralized governance framework.

In a fund-of-funds structure, capital is allocated to external managers who control underwriting and asset-level decisions. The allocator’s role focuses primarily on manager selection and portfolio allocation, rather than direct investment governance. As a result, underwriting authority and day-to-day decision-making are distributed across multiple underlying managers rather than concentrated in a single governance structure.

Why do fund-of-funds structures often involve layered fees?

Fund-of-funds structures typically introduce multiple fee layers because capital passes through more than one investment vehicle before reaching the underlying assets. In many structures, investors may encounter management fees at the fund-of-funds level, management fees charged by underlying managers, and performance or incentive fees at one or both layers. Each individual fee may appear reasonable on its own. However, when multiple layers apply simultaneously, they can reduce the portion of gross returns ultimately retained by the allocator.

How does governance differ between direct investment oversight and delegated fund management?

Governance differs primarily in where decision authority resides. In a direct oversight structure, underwriting standards, leverage limits, and portfolio decisions are typically established within a centralized governance framework. Investment committees or internal policy structures retain authority over capital deployment, extensions, and restructuring decisions.

In a delegated fund structure, governance is distributed across several entities. Underwriting and asset-level decisions are generally made by the underlying managers, while the allocator exercises oversight indirectly through due diligence processes, reporting requirements, and advisory committee participation. The allocator’s influence therefore tends to be advisory rather than directive.

When might a fund-of-funds structure be appropriate for investors?

A fund-of-funds structure may be appropriate when investors prioritize diversification, specialized expertise, or access to managers that would otherwise be difficult to reach directly. Allocators seeking exposure across multiple strategies, geographies, or niche asset classes may use a fund-of-funds approach to build diversified portfolios through established managers. In these cases, the value proposition centers on manager selection and portfolio construction, rather than direct underwriting control. The appropriate structure ultimately depends on the allocator’s objectives, governance preferences, and tolerance for delegated investment authority versus centralized oversight.

Disclaimer: This article is provided for educational purposes only and does not constitute investment advice. Real estate investing involves risk, including the possible loss of capital, and outcomes vary by investor and circumstance. Past performance does not guarantee future results. Readers should consult qualified financial, legal, and tax advisers before acting on any information discussed.

Rental Property vs Real Estate Funds: Which Should You Choose?

Key Takeaways

  • Rental properties and real estate funds are backed by the same underlying assets but deliver fundamentally different investor experiences — control, liquidity, and risk diverge at the structural level, not at the margins.
  • Reported volatility in private real estate is systematically understated due to appraisal smoothing; economic risk accumulates beneath the surface even when appraised values appear stable.
  • Rental property concentrates decision-making and risk at the asset level — rewarding operational skill but exposing owners to tenant concentration, local economic shocks, and unpredictable capital costs.
  • Real estate funds trade control for diversification and professional management, but impose fee drag and liquidity conditions that may tighten precisely when capital is most needed.
  • Choosing the right structure is less about maximizing headline returns and more about matching the investment’s demands — time, operational involvement, liquidity needs — to the investor’s actual constraints.

I. Introduction: Two Ways to Own the Same Asset Class — With Very Different Trade-Offs

At first glance, the choice between owning a rental property and investing through a real estate fund appears straightforward — after all, real estate is real estate. In both cases, the investor is ultimately seeking exposure to income-producing property: rents paid by tenants, property values supported by local economic conditions, and long-term appreciation tied to inflation and growth. This surface similarity has led many investors to treat direct ownership and fund-based real estate as interchangeable routes to the same destination.

That equivalence, however, is largely false.

While rental properties and real estate funds are backed by the same underlying assets — commercial buildings, apartments, or single-family homes — the structure through which ownership is held fundamentally reshapes the investment experience. Control, liquidity, and risk characteristics differ not at the margins, but at the intrinsic nature of the two investment vehicles. Two investors may earn similar long-run average returns from “real estate,” yet arrive there through radically different paths, with very different demands on capital, time, and temperament.

Academic research helps explain why. Studies comparing public and private real estate show that long-run return characteristics can converge, particularly when examined over full market cycles. Hoesli & Oikarinen (2021), for example, find that listed real estate (such as Real Estate Investment Trusts, or REITs) and direct real estate exhibit broadly similar long-term behavior once short-term market noise is stripped away. This has often been interpreted — incorrectly — as evidence that the choice between owning a rental and owning a fund is largely cosmetic.

But other work makes clear why investors’ lived experience can diverge dramatically. Geltner, MacGregor, and Schwann demonstrate that private real estate, whether held directly or through private funds, often appears less volatile primarily because it is valued using appraisals that adjust slowly — a phenomenon known as appraisal smoothing, where infrequent valuations mask real-time changes in economic conditions. Public real estate, by contrast, is continuously priced in liquid markets, producing higher reported volatility even when underlying property cash flows change only modestly. In other words, differences in valuation methodology can mask or exaggerate risk, depending on the structure chosen.

Beyond volatility, structure governs nearly everything else that matters to investors. A rental property offers granular control over leverage, tenants, and capital expenditures, but demands time, operational skill, and tolerance for idiosyncratic risk. Real estate funds offer diversification and professional management, but impose fees, limit control, and often constrain liquidity precisely when it is most valuable. Taxes, too, follow structure, influencing not just how much return is earned, but when and in what form it is realized.

This article examines these trade-offs directly. Rather than asking which option produces the highest headline return, it asks a more practical question: given your constraints, objectives, and willingness to be involved, which structure delivers the best net outcome?

Shoora Capital

Shoora Ground Level

Institutional-grade analysis on Sun Belt real estate, delivered directly to family offices and sophisticated investors. No noise. No marketing. Just the signals that matter — before they show up in the data.

Sign up for Ground Level →

II. Return Generation: How the Money Is Actually Made

Understanding the difference between rental property investing and real estate funds begins with a clear view of how returns are generated in practice — not how they are marketed. Although both ultimately rely on rent paid by tenants and the value of underlying property, the path from tenant rent to investor return differs materially depending on whether ownership is held at the property level or the portfolio level.

A. Rental Property: Property-Level Cash Flow and Equity Growth

In essence, a rental property is a small operating business tied to a single asset (or a small cluster of assets). The mechanics of return generation are relatively transparent:

Gross rent → operating expenses → net operating income (NOI) → debt service → free cash flow

Gross rent reflects local market conditions and tenant quality. From this, the owner subtracts operating expenses, property taxes, insurance, repairs, management fees (if any), utilities, and reserves. The resulting NOI — net operating income — is the fundamental economic engine of the property. After servicing mortgage debt, what remains is free cash flow to the owner.

Beyond cash flow, rental properties generate returns through equity growth, driven by three primary mechanisms. First, rent growth increases NOI over time, directly supporting higher property values. Second, capitalization rate (cap rate) movements — where a cap rate is the ratio of NOI to property value, and the key metric investors use to price income-producing real estate — whether from falling interest rates, improving neighborhood desirability, or tighter investor demand, can reprice the same income stream at a higher valuation multiple. Third, and uniquely for direct owners, forced value creation through capital expenditures and active management can increase NOI independently of broader market conditions. Renovations, re-tenanting, operational efficiencies, or rezoning can all raise value in ways that are not purely passive.

These mechanics mean that returns from rental properties are heavily shaped by owner-specific decisions. Local rent dynamics matter enormously; a well-located property in a growing labor market can experience materially different outcomes from an otherwise similar property in a stagnant area. Financing terms — loan-to-value ratios, interest rates, amortization schedules, and refinancing decisions — directly affect both cash flow and equity accumulation. This mechanism cuts both ways: the same leverage that amplifies gains during appreciation periods magnifies losses when values decline or refinancing conditions tighten. Timing also plays a critical role: the price paid at acquisition and the conditions prevailing at exit can dominate multi-year holding period returns.

However, this property-level focus introduces distinct risks. Tenant concentration is unavoidable: one vacant unit in a single-family rental represents a 100% loss of rental income until re-leased. Local economic shocks — such as the closure of a major employer or changes in zoning or taxation — disproportionately affect individual properties. Capital expenditure surprises — roof replacements, structural repairs, or regulatory compliance upgrades — can erase years of expected cash flow. These risks are not diversified away; they are borne entirely by the owner.

It is worth noting that rental property dynamics vary meaningfully by sub-type. Single-family residential, small multifamily, and commercial properties each carry different concentration profiles, management demands, and financing structures. The dynamics described here are most characteristic of residential and small multifamily ownership; commercial rental properties introduce additional lease complexity and tenant credit considerations.

B. Real Estate Funds: Portfolio-Level Exposure

Real estate funds operate at a fundamentally different level of aggregation. Instead of owning one or a handful of properties, investors gain exposure to a portfolio of assets, with returns generated from pooled NOI, changes in asset valuations, and leverage policies established by the fund manager. This structure can take several forms, ranging from publicly listed Real Estate Investment Trusts (REITs) — companies that own income-producing properties and trade on public exchanges like stocks — to private core funds such as Open-End Diversified Core Equity (ODCE)-style vehicles, and extending to value-add or opportunistic private equity strategies.

In all cases, the mechanics are similar in principle but different in execution. Rental income from dozens or hundreds of properties is aggregated at the portfolio level. Operating costs and debt service are managed centrally. Investors receive returns net of fund expenses, with distributions and net asset value reflecting the combined performance of the underlying assets. Unlike direct ownership, individual asset-level decisions are typically opaque to the end investor.

Return drivers in this context shift from micro-level execution to portfolio construction and policy choices. Asset selection and sector weighting — such as the proportion allocated to apartments versus industrial or office properties — strongly influence performance. Leverage decisions, often applied both at the property and entity level, can amplify returns but also increase downside risk. Crucially, fee drag becomes a structural component of returns: management fees, operating expenses, and in some cases performance fees reduce gross property returns before they reach investors.

Academic and institutional research helps clarify how these differences play out empirically. Cotter & Roll (2011) show that REIT returns often diverge from residential real estate price indexes in the short run, reflecting differences in leverage, sector composition, and public market pricing — even though both are ultimately linked to property fundamentals. This helps explain why fund-based real estate may feel more “equity-like” at times, despite owning tangible assets.

Similarly, institutional analyses such as the Teachers Insurance and Annuity Association (TIAA) private real estate research highlight that differences in reported performance between listed and private real estate are often driven less by underlying income generation than by valuation methodology, leverage, and fees. Portfolio diversification dampens idiosyncratic property-level risk, but it also removes the ability for individual investors to add value through hands-on management.

Comparing the Two Paths

The contrast between rental properties and real estate funds is therefore not a question of what generates returns — both rely on rents and property values — but of where decisions are made and who bears specific risks. Rental properties concentrate return generation and risk at the asset level, rewarding skill, timing, and operational involvement while exposing the owner to idiosyncratic shocks. Real estate funds abstract those same cash flows into portfolio-level exposure, trading control and transparency for diversification, scale, and professional management.

As subsequent sections will show, these structural differences cascade into divergent experiences of volatility and liquidity. What appears, at first glance, to be the same asset class is in practice two very different ways of turning property income into investor returns.

III. Risk, Volatility, and the Illusion of Stability

Risk is often the most misunderstood dimension in the rental property versus real estate fund debate. Investors frequently rely on reported volatility — standard deviation of returns, drawdowns, or price fluctuations — to assess relative safety. Yet academic research shows that reported volatility in real estate frequently reflects how assets are priced, not just the underlying economic risk they carry. As a result, rental properties and private real estate funds can appear deceptively stable when compared to publicly traded real estate, even though their fundamental exposures may be similar.

A. Reported Volatility vs. Economic Risk

Private real estate, whether owned directly as a rental or indirectly through a private fund, is typically valued using appraisal-based methodologies. Appraisals rely on comparable transactions, income capitalization models, and professional judgment — all of which update infrequently and incorporate a degree of smoothing. Because appraisals lag real-time market conditions, measured returns tend to adjust slowly, producing lower reported volatility.

Geltner, MacGregor, and Schwann demonstrate that this appraisal smoothing effect leads to a systematic understatement of true economic volatility in private real estate indexes. The absence of frequent trading does not mean that property values are stable; it means that changes in value are not immediately observed. When market conditions deteriorate — rising interest rates, falling rents, tightening credit — private real estate values do not instantly reprice, but economic risk nonetheless accumulates beneath the surface.

Publicly traded REITs, by contrast, are continuously priced in liquid capital markets. Their share prices incorporate not only current property cash flows, but also investors’ expectations about future rents, financing conditions, and macroeconomic risk. This produces higher short-term volatility and sharper drawdowns, particularly during periods of financial stress. Importantly, however, higher reported volatility does not necessarily imply higher underlying property risk. In many cases, REIT prices adjust faster to information that private market valuations will only reflect months or years later.

Hoesli & Oikarinen (2021) reinforce this distinction by showing that, over longer horizons, the return characteristics of listed and direct real estate tend to converge. Short-run volatility differences largely dissipate when examined across full market cycles, suggesting that the apparent stability of private real estate is, to a significant degree, an artifact of valuation methodology rather than superior risk control.

For individual investors, this has practical implications. A rental property that appears “low volatility” because its appraised value changes little from year to year may still be highly exposed to interest rate shocks, local employment trends, or refinancing risk. Conversely, a REIT investment that fluctuates daily may be providing a more transparent — if emotionally challenging — signal of changing economic conditions.

B. Concentration Risk

Beyond valuation effects, concentration risk is often a more consequential driver of outcomes than volatility statistics. A single rental property represents exposure to one asset, one geographic market, and often one tenant base. A vacancy, major repair, or neighborhood decline can have an outsized impact on cash flow and value. Even small portfolios of rentals remain vulnerable to correlated local shocks.

Real estate funds mitigate this risk through diversification across properties, regions, and tenants. Portfolio-level exposure reduces the impact of any single asset’s underperformance. That said, diversification is not absolute. Funds may still concentrate by sector — such as apartments, office, or industrial — or by strategy, such as value-add or opportunistic investing. Sector-wide downturns can therefore affect fund performance materially, even when individual asset risk is diversified away.

Takeaway

The key lesson is that volatility metrics alone are misleading when comparing rental properties and real estate funds. Appraisal-based smoothing can mask economic risk, while market pricing can exaggerate short-term fluctuations. In practice, concentration and leverage often matter more than reported volatility. Investors who focus solely on smooth returns may underestimate risk, while those who fixate on price swings may overestimate it. Understanding how risk is structured — and how it is revealed over time — is essential to making an informed choice between direct and fund-based real estate ownership.

IV. Liquidity: When Can You Actually Access Your Capital?

Liquidity — how quickly and reliably an investor can convert an asset into cash — is one of the most practical yet underappreciated dimensions separating rental properties from real estate funds. While both offer exposure to income-producing property, they sit at opposite ends of the liquidity spectrum, and the difference becomes most consequential precisely when market conditions deteriorate or capital is urgently needed.

A. Rental Property Liquidity

Rental property is inherently illiquid. Exiting an investment typically involves a multi-step process: marketing the property, negotiating price and terms, completing inspections, securing buyer financing, and closing the transaction. Even in favorable markets, this process can take months, and in weaker conditions it can stretch significantly longer.

Transaction costs further erode effective liquidity. Brokerage commissions, legal fees, transfer taxes, and potential price concessions routinely absorb several percentage points of gross sale value. Unlike liquid securities, where bid–ask spreads are measured in basis points, property transactions impose large, discrete costs that discourage frequent rebalancing or partial exits.

Perhaps more importantly, there is price uncertainty until the sale closes. Appraised values or online estimates provide only rough guidance; the true market price is revealed only when a willing buyer commits capital. In periods of rising interest rates or tightening credit, buyers may re-trade or fail to close, introducing execution risk even after a nominal price has been agreed. For investors relying on property sales to meet liquidity needs — such as funding retirement expenses or reallocating capital — this uncertainty can be material.

The illiquidity of rental property is not necessarily a flaw; for some investors, it imposes discipline and reduces the temptation to trade emotionally. But it does mean that capital is effectively locked in, with limited flexibility to respond quickly to changing circumstances.

B. Fund Liquidity

Real estate funds offer a wide range of liquidity profiles, depending on structure.

Publicly listed REITs provide the highest degree of liquidity. Shares can be bought or sold daily at transparent market prices, allowing investors to rebalance portfolios or raise cash almost instantly. However, this liquidity comes with a trade-off: REIT prices are influenced not only by underlying property cash flows, but also by broader equity-market sentiment, interest rate expectations, and risk appetite. During market stress, REIT prices may fall sharply, even if property-level fundamentals adjust more slowly.

Academic work on REIT liquidity — including research from Hoesli & Oikarinen (2021) — highlights that this distinction is one of timing rather than substance. REIT markets often incorporate information about deteriorating property conditions well before those changes appear in private-market transactions or appraisals. Daily liquidity does not eliminate exposure to real estate cycles; it simply reveals them more rapidly.

Private real estate funds occupy a middle ground. Many offer periodic redemption windows — quarterly or annually — but with important caveats. Redemption requests may be subject to gates, limiting the percentage of fund assets that can be withdrawn at any one time. In stressed markets, funds may impose queues or temporary suspensions to protect remaining investors and avoid forced asset sales. Research from the European Association for Investors in Non-Listed Real Estate Vehicles (INREV) on illiquidity premiums and benchmarking studies from CEM Benchmarking — an independent institutional investment data firm — and Nareit (National Association of Real Estate Investment Trusts) shows that private fund liquidity terms are not theoretical features; they are structural constraints that have been exercised during prior market dislocations, precisely when investors most desired access to capital.

Liquidity as a Strategic Constraint

The critical insight is that liquidity should not be evaluated in isolation, but in relation to when liquidity is needed. Rental properties provide control but little flexibility. REITs provide flexibility but expose investors to market repricing. Private funds promise liquidity, but only conditionally.

From an institutional perspective, investors are compensated for bearing illiquidity risk over long horizons — but only if they can tolerate the constraints when markets seize up. For individual investors, the choice between rentals and funds is therefore less about which asset is “more liquid” in theory, and more about which liquidity profile aligns with their cash flow needs, risk tolerance, and time horizon.

In real estate, the question is not whether liquidity matters, but when you will need it — and under what conditions you can actually get it.

V. Conclusion: Choosing the Structure That Fits the Investor, Not the Asset

The comparison between rental properties and real estate funds ultimately reveals a central insight: the asset class is the same, but the investor experience is not. Both approaches are rooted in income-producing property, both derive value from rents and long-term appreciation, and — over sufficiently long horizons — academic evidence suggests their aggregate return characteristics may converge. Yet, as the preceding sections have shown, how those returns are generated, how risks are revealed, and how capital can be accessed differ in ways that materially shape outcomes for real-world investors.

Rental property ownership concentrates decision-making and risk at the asset level. Returns are driven by local rent dynamics, financing choices, and the owner’s ability to manage operations and capital expenditures. This structure rewards skill, patience, and active involvement, but it also exposes the investor to tenant concentration, local economic shocks, and unpredictable capital costs. Liquidity is limited, exit pricing is uncertain, and capital is effectively committed until a sale can be executed — often at significant cost. For investors willing to treat real estate as an operating business, these constraints can be acceptable, even advantageous, but they are real and unavoidable.

Real estate funds, by contrast, abstract property ownership into portfolio-level exposure. Diversification across assets, tenants, and regions reduces idiosyncratic risk, and professional management shifts day-to-day execution away from the investor. Liquidity improves — dramatically so in the case of listed REITs — but at the price of market repricing and, in private funds, conditional redemption terms that may tighten precisely during periods of stress. Fees and leverage policies become structural features of returns, and individual investors relinquish control over asset selection, timing, and capital allocation.

Perhaps most importantly, reported volatility and headline returns can be misleading guides. Appraisal-based valuations smooth private real estate returns, masking underlying economic risk, while public markets reveal that risk more quickly and visibly. Concentration, leverage, liquidity constraints, and workload often matter more than standard deviation figures when determining whether an investment succeeds or fails for a particular investor.

The practical conclusion is not that one approach is inherently superior. The better choice depends on constraints: time availability, tolerance for operational involvement, liquidity needs, tax circumstances, and behavioral preferences. Investors who optimize solely for gross returns risk overlooking the frictions that determine net outcomes. And no framework — however thorough — can eliminate the execution risk, market timing, and unforeseen conditions that shape real outcomes over a full cycle.

In real estate, structure is not a technical detail — it is the investment. Choosing between rental properties and real estate funds is less about selecting an asset class and more about selecting the set of trade-offs you are prepared to live with through market cycles, execution challenges, and conditions that cannot be fully anticipated in advance.

Frequently Asked Questions

Which produces better returns — rental property or real estate funds?

Neither is categorically superior. Academic research shows that over long horizons, return characteristics can converge. What diverges is how those returns are generated and what the investor must contribute to earn them. Rental properties can generate strong returns for investors who are actively involved and skilled at the asset level. Funds deliver returns net of fees and through diversified exposure, with professional management doing the operational work. The more useful question is not which returns are higher in gross terms, but which structure delivers better net outcomes given your fees, taxes, time costs, and execution capability.

Is rental property really that illiquid? Can’t I just sell it?

Yes — but on the market’s timeline, not yours. Even in strong conditions, a property sale typically takes 60–120 days from listing to close, with transaction costs of 6–8% of gross value absorbing brokerage, legal, and transfer expenses. In weaker markets, buyer financing can fall through after agreement, extending timelines further. Capital is effectively committed until those steps complete. Private real estate funds offer periodic redemption windows, but those windows can be gated or suspended during stress — precisely when liquidity is most needed. Listed REITs are the only structure that provides genuine daily liquidity, though at the cost of daily market repricing.

If private real estate looks stable, doesn’t that mean it’s lower risk?

Not necessarily. The apparent stability of private real estate valuations — including direct rental property — reflects how infrequently those assets are appraised, not the underlying economic risk they carry. Academic research by Geltner, MacGregor, and Schwann demonstrates that appraisal-based returns systematically understate true economic volatility. Risk accumulates beneath the surface during deteriorating conditions even when appraised values hold steady. Investors who equate smooth reported returns with low risk may be underestimating their actual exposure to interest rate shocks, refinancing risk, and local market deterioration.

What happens to fund liquidity when markets turn?

This is where liquidity promises are tested. Private real estate funds commonly include gates — provisions that allow the fund to limit redemptions to a percentage of fund assets per period — and suspension rights that can pause withdrawals entirely. These are not hypothetical features. They have been exercised during prior downturns precisely because funds must avoid forced asset sales that would harm remaining investors. Institutional benchmarking data documents this pattern. If you are investing in a private fund, read the redemption terms carefully and assume that liquidity will be most restricted when you most want it.

How do fees affect my actual return in a real estate fund?

Materially. Fund fees typically include a management fee (commonly 1–2% of assets annually), plus, in many cases, acquisition and disposition fees, and a performance fee or carried interest (often 20% of profits above a preferred return threshold). These fees compound over time and can meaningfully widen the gap between gross property returns and what the investor actually receives. Always evaluate fund performance on a net-of-fee basis, and understand the full fee waterfall before committing capital. Headline returns without fee context are not a reliable guide to net investor outcomes.

Disclaimer: This content is for educational and informational purposes only and should not be construed as investment advice. Real estate investments involve risk, including potential loss of principal. Past performance does not guarantee future results. Consult with qualified financial, legal, and tax professionals before making investment decisions.

Community Revitalization as an Investment Thesis

Key Takeaways

  • Community revitalization is a timing-based pricing inefficiency — not a social initiative. Returns come from entering before demand formation is reflected in asset prices.
  • Asset values increase from two sources: income growth from improved operations, and yield compression as risk perception declines. Yield compression is often the larger driver.
  • Capital enters revitalizing markets in layers — early (local/entrepreneurial), transitional (family offices, regional operators), then institutional. Each layer compresses returns for those that follow.
  • The Decision Framework in this article identifies seven conditions that determine when the revitalization thesis is actionable versus when to step aside.
  • Not every revitalization narrative converts into returns. False demand signals, mis-timed entry, and structural constraints (zoning, infrastructure, overcapitalization) are the primary failure modes.

Pricing Inefficiency, Capital Sequencing, and Asset Revaluation

Community revitalization is not simply a social initiative. It can be a way to capitalize on structural pricing inefficiencies that exist because early-stage demand formation is seen as too risky. The investment opportunity arises because the market underprices assets in areas where demand is forming but not yet visible in current income or comparable sales.

Misclassification: Why Revitalization Is Treated as Charity Instead of Strategy

The prevailing error is not a lack of data. It is a categorization mistake.

Investors tend to group community revitalization alongside two adjacent but analytically distinct domains:

  • Philanthropic capital deployment
  • ESG-aligned allocation strategies

Both frameworks emphasize outcomes external to the asset itself. Returns, if discussed, are treated as secondary or uncertain. This framing implicitly assumes that revitalization is additive to returns at best and dilutive at worst.

That assumption does not hold under scrutiny.

Revitalization is not defined by intent. It is defined by sequence. It occurs at a stage in the capital cycle where:

  • Demand is forming but not yet priced
  • Capital is selective and often fragmented
  • Institutional underwriting frameworks lag observable change

In other words, revitalization sits in the gap between emerging economic reality and recognized asset value.

Labeling this phase as “impact” or “community-focused” obscures the underlying mechanism: early-stage market formation. Markets do not emerge fully priced. They transition through periods where:

  • Perceived risk exceeds actual risk
  • Capital availability is constrained relative to opportunity
  • Pricing generally reflects historical conditions, not forward demand

Investors who interpret revitalization through a moral or signaling lens systematically miss the economic asymmetry embedded in that transition.

This is not a critique of impact-oriented capital. It is a clarification. The return profile is not a byproduct of doing good. It is a function of entering before pricing adjusts.

Revitalization Compared to Adjacent Investment Strategies

Revitalization is often conflated with other strategies that operate in superficially similar environments but rely on different return drivers.

ESG (Environmental, Social, and Governance) investing is typically intent-driven. Capital is allocated based on environmental or social criteria, with financial performance evaluated alongside non-financial outcomes. The underlying assumption is that values alignment may influence long-term returns, but the investment framework does not depend on timing inefficiencies in market formation.

Distressed investing focuses on dislocation, but of a different kind. Assets are impaired due to capital structure stress, operational failure, or cyclical downturns. The opportunity is created by forced selling or restructuring complexity, not by the early emergence of new demand.

Opportunistic real estate strategies may intersect with revitalizing markets, but they are defined by risk tolerance and return targets rather than by a specific phase of market development. They often rely on leverage, redevelopment, or leasing execution across a range of market conditions.

Revitalization differs in that it is not anchored in intent, distress, or mandate. It is a function of timing within a market’s evolution. The opportunity exists because pricing reflects outdated risk perceptions while forward demand is already forming.

Misclassification has practical consequences. Capital is either excluded or mispriced. Institutional investors tend to enter late, once data confirms stability, while early-stage risk is over-penalized relative to actual conditions.

The result is a persistent gap between economic reality and asset pricing.

We read it this way: revitalization is not a capital category. It is a timing-based pricing inefficiency within the broader real estate cycle.

The Investment Thesis: Demand Precedes Pricing, and Pricing Follows Capital

The community revitalization investment thesis, as we frame it, can be stated precisely:

Investing in undercapitalized but demand-forming communities creates asymmetric upside because asset pricing lags both economic activity and capital inflows.

Mechanism:

    • Early investment supports or anticipates demand formation (residential, commercial, or mixed-use)
    • Incremental capital reduces perceived risk and increases liquidity
    • Market participants reprice assets as occupancy, income, and transaction volume stabilize

Outcome:

  • Above-market appreciation driven by repricing, not just income growth
  • Yield compression as risk perception declines
  • Multiple expansion on exit due to broader buyer participation

In our assessment, this is not a speculative thesis. The pattern is observable across cycles and geographies — what varies is timing, execution discipline, and capital structure.

The critical distinction is that returns are generated not simply from holding assets, but from positioning within a specific phase of market development.

Decision Framework: When the Revitalization Thesis Is Actionable

The thesis is not universally applicable. It depends on identifying markets where pricing lags observable economic transition, and where that transition is likely to sustain.

The following framework is intended to convert the thesis into a screening tool for capital allocation.

1. Entry Condition: Evidence of Demand Formation (Not Narrative)

Invest when:

    • Residential occupancy is increasing from previously depressed levels
    • Population inflow is observable (even if modest)
    • Early-stage commercial activity exists (service retail, local businesses)

Avoid when:

  • Demand signals are isolated or episodic
  • Activity is driven primarily by announced projects rather than lived usage
  • Vacancy remains structurally elevated without directional improvement

2. Pricing Condition: Misalignment Between Perception and Reality

Invest when:

    • Asset pricing reflects historical decline rather than current trajectory
    • Comparable sales lag observable leasing or occupancy trends
    • Cap rates embed a risk premium inconsistent with on-the-ground conditions

Avoid when:

  • Pricing has already adjusted to reflect forward expectations
  • Market narratives are widely disseminated and capital inflows are accelerating
  • Yield compression has largely occurred prior to entry

3. Capital Sequencing Position: Early or Transitional Phase

Invest when:

    • Capital is fragmented, local, or relationship-driven
    • Institutional participation is limited or absent
    • Financing is available but not yet fully competitive

Avoid when:

  • Institutional capital is actively deploying at scale
  • Transaction volume is high and price discovery is efficient
  • Market entry is driven by momentum rather than underwriting

4. Structural Viability: Ability for Feedback Loops to Sustain

Invest when:

    • Infrastructure is already in place but underutilized
    • Zoning and policy environment permit incremental growth
    • Demand drivers (employment access, affordability) are durable

Avoid when:

  • Structural constraints (zoning, infrastructure, policy) limit scalability
  • Demand depends on a single catalyst or employer
  • Growth requires large, coordinated capital rather than incremental activation

5. Execution Feasibility: Asset-Level Alignment with Market Transition

Invest when:

    • Assets can stabilize with modest capital expenditure
    • Layout and location align with emerging tenant demand
    • Leasing risk is operational, not structural

Avoid when:

  • Assets require heavy redevelopment to achieve market fit
  • Tenant demand is speculative rather than observable
  • Execution depends on future market conditions rather than current signals

6. Risk Discipline: Timing and Capital Structure Sensitivity

Invest when:

    • Entry basis allows for extended stabilization timelines
    • Leverage is conservative relative to income volatility
    • Capital structure can absorb delayed repricing

Avoid when:

  • Returns depend on rapid appreciation or cap rate compression
  • Leverage magnifies downside in early-stage volatility
  • Holding period assumptions are narrow or inflexible

7. Exit Visibility: Presence of a Future Buyer Base

Invest when:

    • There is a clear path to broader buyer participation
    • Comparable markets have transitioned through similar phases
    • Exit pricing can reasonably reflect stabilized conditions

Avoid when:

    • Exit depends on continued narrative expansion rather than fundamentals
    • Buyer pool remains structurally limited
    • Liquidity is unlikely to improve within the investment horizon

    Summary Decision Rule

    The revitalization thesis is most actionable when all three conditions are present simultaneously:

    • Demand is forming but not fully priced
    • Capital has not yet normalized pricing
    • Market structure allows transition to sustain

    If any one of these conditions is absent, the return profile shifts from asymmetric to conventional, or deteriorates entirely.

    A Structured Model of Value Formation

    The thesis can be formalized as a function of three interacting variables: demand growth, risk compression, and liquidity expansion.

    Demand growth reflects the underlying economic engine. It is observable through population inflows, rising occupancy, and increasing commercial activity. Importantly, it often precedes measurable rent growth, particularly in early-stage markets where pricing has not yet adjusted.

    Risk compression follows as uncertainty declines. This is not purely a function of improved fundamentals, but of increased confidence in their persistence. As volatility in income and occupancy stabilizes, required returns begin to decline.

    Liquidity expansion occurs as more participants enter the market. Transaction volume increases, financing becomes more accessible, and price discovery improves. Liquidity is both a result of and a contributor to risk compression.

    These variables do not move independently. They reinforce one another over time.

    Structured model of value formation in revitalization markets — demand growth, risk compression, and liquidity expansion as interacting variables

    Timing asymmetry is central. Entry pricing reflects historical risk—often anchored in outdated data or perception. Exit pricing reflects forward expectations, shaped by observed momentum and increased capital participation.

    As a result, returns are driven less by incremental income growth alone and more by the repricing of risk.

    This pattern is generally repeatable across markets, though not uniform in timing or magnitude. It is a structural feature of how markets transition from undercapitalized to fully recognized.

    The Economic Engine: How Revitalization Produces Financial Returns

    Revitalization is not a single event. It is a sequence of reinforcing mechanisms. Understanding these mechanisms is essential because each one contributes to the eventual repricing of assets.

    Demand Creation: The Foundational Driver

    Revitalization begins with demand, but not in its mature form.

    Demand emerges incrementally through overlapping forces:

    Stage 1: Population Shifts (Initial Demand Signal)

    Population movement is rarely random. It tends to follow affordability gradients and employment access.

    In early-stage revitalization areas:

    • Housing costs are meaningfully below regional averages
    • Proximity to employment centers remains viable
    • Infrastructure already exists but is underutilized
    • This creates a migration pattern characterized by:
    • Renters priced out of primary markets
    • Younger households prioritizing cost over established amenities
    • Small-scale owner-occupants seeking entry points

    The initial population inflow is not large, but it is directionally important. It establishes baseline occupancy and begins to stabilize revenue streams.

    Stage 2: Business Formation (Local Economic Activation)

    As residential density increases, commercial viability follows.

    Early business activity is typically:

    • Locally owned
    • Service-oriented
    • Capital-light
    • Examples include:
    • Food and beverage
    • Personal services
    • Small retail

    These businesses do not require high foot traffic initially. They rely on proximity and repeat demand.

    From an investment perspective, this matters because:

    • It diversifies income sources within the community
    • It increases perceived livability
    • It signals to subsequent investors that the area can support commercial activity

    This is not growth in the abstract. It is the gradual conversion of latent demand into observable economic activity.

    Stage 3: Consumption Expansion (Demand Reinforcement)

    Consumption follows both population and business formation.

    The shift is not only in volume but in composition:

    • Higher frequency of local spending
    • Reduced leakage to adjacent markets
    • Increased willingness to pay for convenience
    • This has second-order effects:
    • Improved unit economics for businesses
    • Higher rents justified by stronger sales
    • Increased tax revenue, which can support infrastructure improvements

    The key point is that demand creation is cumulative. Each incremental change increases the probability of subsequent changes.

    Markets do not wait for full transformation. They respond to directional signals.

    Feedback Loops, Thresholds, and Non-Linear Acceleration

    Once consumption expands, the system begins to exhibit reinforcing feedback loops. Population growth supports business formation, which increases service density, which in turn improves resident retention. Each element strengthens the others.

    These loops are not linear. Early changes may appear incremental, but they can reach thresholds where new categories of activity become viable. For example, a critical mass of residents may support higher-quality retail, healthcare services, or institutional tenants that were previously infeasible.

    At these thresholds, capital perception shifts more quickly than underlying fundamentals alone would suggest. This is partly driven by signal amplification. Small but visible changes—a well-trafficked restaurant, a renovated streetscape, a new anchor tenant—can disproportionately influence how external investors interpret the market.

    However, early-stage systems remain fragile. Demand can stall, businesses can fail, and capital can withdraw if momentum is not sustained. The feedback loops require continuity.

    When they hold, the transition tends to accelerate. Revitalization does not progress in a straight line; it moves through phases where change compounds and becomes more legible to outside capital.

    Shoora Capital

    We invest alongside sponsors who understand market timing — targeting the transition phase where pricing reflects legacy risk, not forward demand. If you are evaluating where specific markets sit within this cycle, we can work through the framework with you directly.

    Discuss a Specific Opportunity

    Capital Follows Momentum: The Sequencing of Investment

    Capital does not enter all at once. It arrives in layers, each with distinct characteristics.

    Capital sequencing layers in community revitalization — early entrepreneurial capital, transitional family office capital, and institutional validation phase

    Early Capital: Fragmented and Undercompensated

    The first capital into revitalizing communities is often:

    • Local
    • Entrepreneurial
    • Structurally flexible
    • It operates without the benefit of:
    • Deep liquidity
    • Institutional validation
    • Established comparables
    • As a result:
    • Pricing remains suppressed
    • Financing is more expensive or limited
    • Execution risk is higher

    However, this capital also captures the largest potential upside because it enters before the market recognizes the shift.

    Transitional Capital: Pattern Recognition

    As observable metrics improve—occupancy, rent stability, transaction volume—capital becomes more systematic.

    This phase includes:

    • Regional operators
    • Smaller private equity groups
    • Family offices
    • Characteristics:
    • More structured underwriting
    • Increased access to financing
    • Willingness to accept moderate execution risk
    • At this stage:
    • Pricing begins to move
    • Comparable sales become more reliable
    • Liquidity improves

    Importantly, returns begin to compress relative to early entrants, but remain attractive due to continued repricing potential.

    Institutional Capital: Validation and Compression

    Institutional capital typically enters last.

    Its requirements include:

    • Stable income streams
    • Sufficient transaction volume
    • Established market data
    • Once these conditions are met:
    • Capital availability increases significantly
    • Cap rates compress
    • Competition intensifies
    • This phase often coincides with:
    • Large-scale development
    • Infrastructure investment
    • Broader market recognition
    • By this point, the majority of the repricing has occurred.

    In our reading, institutional capital does not create the opportunity. It validates and prices it.

    Asset Repricing: Where Returns Are Realized

    The culmination of demand creation and capital inflow is asset repricing.

    This occurs through several channels:

    Translating Repricing into Financial Outcomes

    At entry, assets in revitalizing markets typically exhibit a combination of high capitalization rates (cap rates), inconsistent occupancy, and limited comparable transactions. Pricing reflects uncertainty more than stabilized income potential.

    Consider a simplified progression. An investor acquires an asset at a high going-in yield due to vacancy and perceived location risk. Over time, occupancy stabilizes and rents increase modestly. On a standalone basis, this income growth may appear incremental.

    However, the more significant shift occurs in the market’s required return. As transaction volume increases and comparable assets begin to trade at lower cap rates, the same income stream is capitalized more aggressively.

    The interaction is multiplicative. Modest net operating income growth combined with cap rate compression can produce disproportionate increases in asset value.

    Returns can be decomposed into three layers:

    • Income growth from improved leasing and operations
    • Yield compression as perceived risk declines
    • A liquidity premium as the buyer pool expands

    Repricing is fundamentally a reclassification of risk. The asset does not become valuable solely because income increases. It becomes more valuable because the market assigns a different level of certainty to that income.

    Asset repricing mechanism — how occupancy stabilization and cap rate compression interact to produce outsized total returns in revitalization strategies

    Real Estate Appreciation

    Property values increase as:

    • Net operating income rises
    • Vacancy declines
    • Market comparables adjust upward
    • However, appreciation is not purely income-driven. It is also perception-driven.
    • As the market assigns lower risk to the area:
    • Required returns decrease
    • Buyers are willing to pay more for the same income stream
    • This is the essence of repricing.

    Yield Compression

    Yield compression reflects a change in perceived risk.

    In early-stage markets:

    • Investors demand higher yields to compensate for uncertainty
    • Exit liquidity is limited
    • As the market stabilizes:
    • Risk premiums decline
    • Financing becomes more accessible
    • Buyer pools expand
    • This leads to:
    • Lower cap rates
    • Higher asset values for the same income

    Yield compression is often the largest contributor to outsized returns in revitalization strategies.

    Liquidity Expansion

    Liquidity is a function of participation.

    As more investors recognize the market:

    • Transaction volume increases
    • Price discovery improves
    • Exit options expand
    • Liquidity reduces friction in both entry and exit.
    • This matters because:
    • It allows investors to realize gains more efficiently
    • It supports more aggressive underwriting by subsequent buyers

    Repricing is not a single event. It is a process driven by successive layers of validation.

    Why Revitalization Produces Outsized Returns

    Our view is that the return profile associated with community revitalization is not accidental. It is the result of persistent, structural market inefficiencies — not narrative or timing luck.

    Information Lag

    Data in emerging markets is inherently backward-looking.

    Comparable sales reflect prior conditions

    Appraisals rely on limited transactions

    Institutional models require historical stability

    This creates a gap between:

    • Real-time economic activity
    • Reported market data

    Investors who rely exclusively on formal data sources tend to underwrite these markets conservatively or avoid them entirely.

    This lag allows informed operators to act on leading indicators rather than confirmed trends.

    Behavioral Bias

    Investor behavior reinforces the inefficiency.

    Common biases include:

    • Recency bias: overweighting past decline
    • Reputation bias: associating areas with outdated perceptions
    • Complexity aversion: avoiding markets that require granular analysis

    These biases lead to systematic underallocation of capital to revitalizing areas, even when fundamentals are improving.

    Markets do not price fundamentals alone. They price perception.

    Capital Allocation Gaps

    Large pools of capital face structural constraints:

    • Minimum deal sizes
    • Liquidity requirements
    • Mandate limitations

    These constraints make early-stage revitalization markets difficult to access at scale.

    As a result:

    • Smaller investors dominate early phases
    • Capital supply is insufficient relative to opportunity
    • Pricing remains inefficient longer than in more liquid markets

    This is not a temporary condition. It is a structural feature of how capital is organized.

    Underwriting Framework Limitations

    Traditional underwriting relies on:

    • Stabilized income
    • Comparable transactions
    • Predictable expense structures
    • Revitalization markets often lack these inputs.
    • This leads to:
    • Higher discount rates
    • Conservative assumptions
    • Missed opportunities

    Investors who can underwrite based on forward-looking indicators—population trends, business formation, infrastructure investment—gain an advantage.

    However, this requires discipline. Not all emerging markets transition successfully. Selectivity remains critical.

    Position Within the Deal Lifecycle: Where Value Is Created

    Revitalization is not an overlay applied to an investment. It is the phase in which value is created.

    At entry:

    • Assets are priced based on historical conditions
    • Income may be below potential
    • Perceived risk is elevated
    • During execution:
    • Demand increases
    • Income stabilizes and grows
    • Market perception shifts
    • At exit:
    • Pricing reflects stabilized conditions
    • Cap rates compress
    • Buyer pools expand
    • The distinction is important.

    Returns are often attributed to exit timing or market cycles. In revitalization strategies, the primary driver is the transition between entry conditions and stabilized market recognition.

    This aligns directly with the framework outlined in our investment philosophy on private real estate, where value creation is tied to mispriced risk rather than passive market exposure.

    Similarly, understanding how revitalization fits into acquisition, execution, and disposition phases requires a lifecycle view. The mechanics are explored in more detail in our analysis of the real estate capital stack, but the central point remains: the majority of return is embedded at entry, not engineered at exit.

    Failure Modes and Constraints in Revitalization Strategies

    The presence of a structural inefficiency does not ensure that any given market will transition successfully. Several failure modes recur with enough frequency to warrant explicit consideration.

    First, false demand signals. Early indicators—such as limited population inflow or isolated business openings—may not represent durable trends. Without sustained demand, the feedback loops necessary for revitalization fail to establish.

    Second, mis-timed capital entry. Entering too early can result in extended holding periods with limited income growth, while entering too late compresses returns as pricing has already adjusted. Timing risk is distinct from selection risk, though the two often interact.

    Third, structural constraints. Zoning restrictions, infrastructure limitations, or adverse policy environments can inhibit development regardless of underlying demand. These factors can cap upside or delay transition beyond acceptable investment horizons.

    Overcapitalization presents an additional risk. If capital enters too quickly relative to demand, new supply can outpace absorption, suppressing rents and prolonging stabilization.

    Not all revitalization narratives convert into investable outcomes. The thesis is directionally valid, but it is contingent on market-specific execution, sequencing, and constraint analysis.

    Investor Implications: How to Apply the Thesis

    The community revitalization investment thesis is not universally applicable. It requires a specific approach to both market selection and execution.

    Market Selection Criteria

    Investors should prioritize markets where:

    • There is evidence of early demand formation
    • Infrastructure exists but is underutilized
    • Pricing reflects historical decline rather than current trajectory
    • Indicators may include:
    • Increasing occupancy in residential assets
    • Early-stage commercial activity
    • Public or private investment in infrastructure

    These signals do not guarantee success. They increase the probability of transition.

    Asset-Level Considerations

    Within selected markets, asset characteristics matter.

    Favorable attributes include:

    • Functional layouts that require limited structural changes
    • Locations with proximity to emerging commercial nodes
    • Flexibility in tenant mix

    Assets that require extensive repositioning introduce additional risk that may not be compensated by pricing.

    Capital Structure Discipline

    Leverage can amplify returns, but it also increases vulnerability during transitional phases.

    Investors should consider:

    • Conservative leverage at entry
    • Flexibility in financing terms
    • Sufficient reserves for execution risk

    Revitalization timelines are not linear. Capital structures must accommodate variability.

    Execution Capability

    The thesis depends on more than market selection.

    Execution includes:

    • Property management aligned with evolving tenant profiles
    • Incremental capital improvements tied to demand
    • Active leasing strategies
    • Passive ownership is unlikely to capture the full benefit of market transition.

    Exit Strategy Awareness

    Exit conditions should be considered at entry.

    Investors should evaluate:

    • Likely buyer profiles at stabilization
    • Comparable markets that have completed similar transitions
    • Sensitivity to cap rate changes
    • Exit is not an afterthought. It is the realization of the repricing thesis.

    Closing: Selective Exposure to Mispriced Transition

    Community revitalization is best understood as a phase where markets transition from underrecognized to fully priced.

    It is not uniformly attractive. It is not risk-free. It is not driven by narrative.

    It is driven by:

    • Demand formation ahead of recognition
    • Capital inflows that validate and accelerate change
    • Asset repricing that reflects reduced uncertainty

    For investors willing to operate within that transition—accepting variability, underwriting forward conditions, and executing with discipline—the return profile can be meaningfully different from stabilized market strategies.

    Opportunities are inherently local and require detailed analysis. Broad generalizations tend to obscure more than they reveal.

    Frequently Asked Questions

    Is community revitalization investing the same as impact investing?

    No. Revitalization investing is defined by timing within the capital cycle — entering when demand is forming but not yet reflected in asset pricing. Impact investing is intent-driven and evaluates non-financial outcomes alongside returns. The return mechanisms are structurally distinct, even when they operate in overlapping geographies.

    What are the biggest risks in revitalization strategies?

    The primary failure modes are: false demand signals that don’t represent durable trends; mis-timed entry — too early means extended holding with limited income growth, too late means pricing has already adjusted; structural constraints including zoning, infrastructure, or policy limitations; and overcapitalization, where new supply outpaces demand absorption.

    When should an investor avoid a revitalization market?

    When pricing has already adjusted to reflect forward expectations, when institutional capital is actively deploying at scale, when market narratives are widely disseminated, or when demand signals are isolated rather than directionally sustained. The return profile shifts from asymmetric to conventional — or deteriorates — when these conditions apply.

    How does the return profile of revitalization strategies differ from stabilized real estate?

    Stabilized strategies primarily generate returns through income growth and dividend yield. Revitalization strategies add a second return layer: yield compression as risk perception declines and the buyer pool expands. This repricing component is often the larger driver of total return in successful revitalization investments.

    What role do family offices play in the capital sequencing of revitalization markets?

    Family offices typically represent the transitional capital layer — entering after early observable metrics improve (occupancy, rent stability, transaction volume) but before institutional capital normalizes the market. They accept moderate execution risk in exchange for continued repricing potential, and their participation is often a leading indicator that a market is transitioning toward institutional recognition.


    Disclaimer: This content is for educational and informational purposes only and should not be construed as investment advice. Real estate investments involve risk, including potential loss of principal. Past performance does not guarantee future results. Consult with qualified financial, legal, and tax professionals before making investment decisions.

    Why Is Institutional Capital Overlooking Tier-2 Sun Belt Cities?

    Key Takeaways

    • Tier-2 Sun Belt metros — cities like Huntsville, Greenville, and Chattanooga — show durable population and employment growth, yet remain structurally underweighted in institutional real estate portfolios.
    • The underallocation is not a data gap. Institutional screening models, benchmark constraints, and career-risk incentives systematically filter out these markets before qualitative analysis ever begins.
    • Capital concentration in Tier-1 markets has created a new risk: valuation sensitivity. Markets priced on forward assumptions are now more exposed to capital market shifts than to how the underlying properties perform.
    • Tier-2 markets offer higher initial yields, less competitive underwriting, and demand anchored in defense, manufacturing, and healthcare — not sentiment-driven migration.
    • The structural constraints that prevent institutional reallocation are durable, not cyclical. That durability is precisely what defines the opportunity for patient, non-institutional capital.

    The Tier-2 Sun Belt Paradox: Strong Fundamentals, But Where’s the Capital?

    Across the Sun Belt, a familiar pattern has emerged. A subset of secondary metropolitan areas—places like Huntsville, Greenville, Chattanooga, and Fayetteville—are expanding faster than many of their Tier-1 counterparts on the metrics investors claim to value most. Population inflows remain durable. Employment growth is often anchored by a small number of resilient industries rather than speculative booms. Housing supply, particularly in workforce and middle-income segments, continues to lag demand.

    On paper, these are not fragile markets. They are not dependent on a single employer, nor are they purely lifestyle-driven migration stories. In many cases, they benefit from developments that manifest over a long cycle, such as defense spending, manufacturing reshoring, healthcare expansion, and logistics infrastructure. Such forces tend to be less volatile than the technology or financial services concentrations common in larger metros. Operating fundamentals reflect this. Rent growth has generally outpaced inflation. Vacancy rates remain tight. New construction, while increasing, has not kept pace with household formation. According to U.S. Census Bureau data, 14 of the 15 U.S. metros with the highest net domestic in-migration rates between 2023 and 2024 were in the Southeast — a pattern that includes secondary metros like Greenville and Chattanooga, confirming that Sun Belt growth has extended well beyond the largest institutional markets.

    Yet institutional capital has largely bypassed these markets despite their strong fundamentals. Ownership by large private equity firms, REITs, and pension-backed vehicles remains heavily concentrated in Tier-1 Sun Belt metros such as Dallas, Phoenix, Atlanta, and Austin. Allocation patterns have barely shifted, even as relative pricing in those markets has compressed yields and raised sensitivity to future rent growth assumptions. The result is a persistent divergence: capital pools in the largest, most visible cities, while smaller, but often faster-growing, markets remain comparatively undercapitalized.

    At first glance, this looks like a contradiction. If growth, migration, and supply constraints are the inputs, why does capital flow elsewhere? The superficial explanation is that institutions are “missing” the data or underestimating the opportunity. But maybe not. The data are not hidden. Demographics, employment trends, and housing shortages in Tier-2 Sun Belt cities are well documented and widely accessible.

    An alternative diagnosis points to operational factors. Institutional capital is not failing to observe these markets; it is disincentivized from participating in them. Allocation models, liquidity requirements, benchmark constraints, and career-risk considerations favor large, highly liquid metros, often regardless of marginal fundamentals. In our view, the underallocation to Tier-2 Sun Belt cities is not an accident or a temporary oversight. It reflects the predictable outcome of how institutional real estate capital is designed to operate.

    What Defines a “Tier-2” Sun Belt Market (and Why the Label Matters)

    In institutional real estate, market “tiers” are not formal classifications. They are heuristics: shorthand used by investment committees, consultants, and allocation models to simplify decision-making at scale. Tier-1 Sun Belt markets typically include large, highly liquid metros such as Dallas, Atlanta, Phoenix, and Austin. These cities combine population scale, transaction volume, deep buyer pools, and extensive research coverage. They are familiar, benchmarked, and easy to justify in an institutional context.

    Tier-2 Sun Belt markets sit just below that threshold. They are not rural or economically marginal. Most fall in the 200,000 to 1 million metro population range. Employment growth is typically driven by two to four anchor industries—often combinations of manufacturing, defense, healthcare, education, and logistics—rather than a single dominant employer. Rent growth has tended to exceed inflation over long periods, supported by steady in-migration and the low price elasticity of housing supply. Importantly, institutional ownership remains low relative to market size.

    From an operating perspective, many of these markets exhibit characteristics investors say they prefer: less volatile demand, lower land and construction costs, and rent levels that are still accessible to local wage bases. Pricing inefficiencies persist because capital competition is thinner. Yet these same traits are often reframed as weaknesses in institutional underwriting. Smaller deal sizes, fewer comparable sales, and longer marketing periods on exits are treated as structural risk rather than structural differences.

    But these features reflect differences in market structure that change execution mechanics but do not inherently increase asset-level loss risk or impair long-term risk-adjusted returns. The result is a model-mismatch problem, where Tier-2 markets are penalized for not fitting large-fund templates rather than for having weaker fundamentals.

    The label itself matters because it functions as an early filter. In many investment memos, “Tier-2” implicitly signals lower liquidity, higher perceived idiosyncratic risk, and greater reputational exposure if a deal underperforms. That perception can be enough to halt a proposal before deeper analysis begins. By the time qualitative factors—employer diversity, housing undersupply, demographic durability—are considered, the market may already have failed quantitative screens tied to transaction volume or assumed exit velocity.

    This is where classification becomes self-reinforcing. Because Tier-2 markets attract less institutional capital, they generate fewer large transactions. Fewer transactions reduce benchmark representation and research coverage. That lack of visibility then justifies continued exclusion. The designation is not merely descriptive; it has causal implications.

    Understanding this distinction is critical. The “Tier-2” label does not necessarily mean weaker fundamentals. It reflects a mismatch between how institutions are structured to deploy capital and how these markets actually grow. In practice, the label often says more about the allocator than the city.

    Zen saying: The finger pointing to the moon is not the moon.

    Tier-1 vs. Tier-2 Sun Belt: Key Structural Differences

    Characteristic Tier-1 Sun Belt Tier-2 Sun Belt
    Example metros Dallas, Phoenix, Atlanta, Austin Huntsville, Greenville, Chattanooga, Fayetteville
    Metro population 2M–8M+ 200K–1M
    Institutional ownership High Low
    Initial yields Compressed Higher
    Transaction volume Deep Thinner
    Benchmark coverage Strong Minimal
    Primary demand anchors Diversified / tech & finance Defense, manufacturing, healthcare, logistics
    Construction pipeline Active (oversupply risk in some markets) Lagging household formation
    Exit buyer pool National and global institutional Regional operators, family offices
    Capital competition Intense Limited

    How Institutional Screening Models Systematically Exclude Tier-2 Cities

    For most large allocators, the underrepresentation of Tier-2 Sun Belt markets is not the result of an explicit negative view. It is the byproduct of screening models designed to optimize for scale, speed, and comparability rather than localized operating outcomes. Long before an investment team debates job growth or housing undersupply, many of these markets have already been filtered out by mechanical constraints embedded in institutional practice.

    Liquidity thresholds are the first gate. Large funds typically require a minimum level of annual transaction volume within a metro to support underwriting assumptions around entry and exit. These thresholds are often justified as risk controls: deeper markets are assumed to offer more reliable price discovery and faster dispositions. Tier-2 metros, by definition, transact less frequently and in smaller aggregate dollar amounts. Even if pricing volatility is lower in practice, lower volume alone can cause a market to fail initial screens.

    Exit assumptions reinforce this bias. Institutional models frequently rely on standardized hold periods and assumed buyer depth at exit. Markets with fewer institutional buyers are penalized, even if they have robust regional or local demand. The presence of owner-operators, family offices, or regional investors is often discounted relative to national capital, even though these buyers may be more consistent participants in smaller metros. As a result, thinner institutional buyer pools are conflated with higher capital impairment risk, rather than recognized as a different liquidity structure.

    Comparable sales requirements further narrow the funnel. Many investment committees require a critical mass of recent, like-for-like transactions to validate pricing and exit capitalization rates (cap rates). In Tier-2 markets, assets trade less frequently, and deals are more heterogeneous. That does not prevent rational valuation, but it complicates standardized modeling. When comparables are scarce or imperfect, underwriting confidence declines, not because fundamentals are weak, but because the data are less uniform.

    assets under management (AUM) deployment pressure compounds the issue. Large funds must place capital in increments that move the needle. Deploying $50 million across multiple smaller transactions in different Tier-2 metros is operationally complex, slower, and harder to monitor than writing a single $200 million check in a Tier-1 market. Even when risk-adjusted returns appear superior on a deal-by-deal basis, portfolio construction incentives favor fewer, larger assets in familiar locations.

    The cumulative effect is exclusion before judgment. Tier-2 markets often fail screens tied to transaction volume, assumed exit velocity, buyer density, or minimum deal size before qualitative analysis begins. By the time local economic resilience, rent durability, or supply constraints could be evaluated, the opportunity has already been disqualified.

    Tier-2 markets are subject to ex ante exclusion from institutional allocation models

    Importantly, this is not a flaw in execution. It is a design choice. Institutional screening models are built to reduce variance, simplify reporting, and protect careers as much as capital. Those objectives naturally privilege markets that already attract institutional money. The result is a feedback loop: high-return smaller markets are screened out not because they lack merit, but because they do not conform to the operating requirements of large pools of capital.

    Understanding this mechanism reframes the question. Institutions are not actively rejecting Tier-2 Sun Belt cities after careful comparison. In many cases, they never reach the point of comparison.

    Benchmark and Index Effects (The Hidden Gravity Well)

    Even when institutional investors recognize relative value outside Tier-1 markets, benchmark alignment exerts a powerful, often underappreciated pull. Capital does not flow freely across markets based solely on fundamentals. It flows along channels shaped by indices, peer comparisons, and reporting conventions. Over time, those channels become gravity wells.

    Most large real estate allocators are measured against benchmarks derived from existing institutional ownership. Indices such as NCREIF (National Council of Real Estate Investment Fiduciaries) and MSCI (a global index provider) are constructed from properties already held by institutional managers. Public market analogues, such as REIT indices and sector composites, reflect similar concentration. Markets with deep institutional penetration are heavily represented; markets without it are effectively invisible. Performance measurement, risk attribution, and relative ranking all flow from this starting point.

    This creates a circular dynamic. Capital is allocated to markets with strong benchmark representation because that is where performance can be most easily contextualized and defended. As more capital concentrates there, transaction volume increases, price discovery accelerates, and index weightings grow. Tier-2 markets, by contrast, remain lightly indexed precisely because they are lightly owned. Their absence from benchmarks is not evidence of inferior fundamentals; it is evidence of historical underallocation.

    Benchmark effects also influence behavior at the manager level. Deviating meaningfully from index exposure introduces tracking error, even if absolute returns improve. For a fund manager, underperforming peers in a benchmark-heavy market is typically attributed to market timing or cycle dynamics. Underperforming in a lightly indexed, less familiar market is more likely to be framed as a judgment error. The asymmetry matters. Career risk rises as benchmark distance increases.

    Research coverage reinforces the same pattern. Sell-side reports, consultant surveys, and third-party forecasts tend to focus on markets where institutional capital is already active. Data quality improves where transaction volume is high, which further legitimizes those markets in underwriting models. Meanwhile, Tier-2 metros generate fewer datapoints, attract less analyst attention, and remain harder to “score” within standardized frameworks. The absence of coverage becomes a reason to avoid them, even when primary data—population growth, employment trends, housing supply—are readily observable.

    The result is a self-reinforcing loop. Benchmarks guide capital. Capital determines benchmarks. Markets outside that loop struggle to gain visibility regardless of operating performance. Importantly, this is not herd behavior driven by ignorance. It is a rational response to how success is measured and risk is penalized within institutional systems.

    For Tier-2 Sun Belt cities, the consequence is persistent underrepresentation. Not because they fail to grow, but because growth alone is insufficient to overcome the gravitational pull of benchmark-driven capital allocation.

    Liquidity, Exit Assumptions, and Overstated Risk

    Liquidity is the most frequently cited rationale for avoiding Tier-2 Sun Belt markets. It is also one of the most consistently mis-modeled. In institutional underwriting, liquidity risk is often treated as binary: markets are either “deep” enough to support predictable exits or they are not. This framing obscures how liquidity actually functions in smaller metros and leads to conservative assumptions that overstate capital impairment risk.

    At the core of the issue is exit modeling. Many institutional models rely on standardized hold periods and assumed buyer universes dominated by national or global capital. In Tier-1 markets, this assumption is reasonable. A large pool of institutional buyers exists at nearly all points in the cycle. In Tier-2 markets, the buyer base is different rather than absent. Regional operators, local owner-operators, and family offices often account for the majority of transactions. These buyers may be less price-aggressive in frothy markets, but they tend to be more durable across cycles, particularly for stabilized assets with predictable cash flow.

    Institutional underwriting frequently discounts this buyer pool. Longer marketing periods or fewer institutional bidders are interpreted as elevated risk, even when historical outcomes do not show higher loss severity. In practice, longer hold periods do not inherently reduce returns. They change the return profile. Cash flow contributes more to total return, while terminal value contributes less. For investors underwriting yield and durability rather than rapid multiple expansion, this trade-off can be favorable.

    The false equivalence between “thinner buyer pool” and “higher downside risk” is another source of distortion. In many Tier-2 markets, operating income is less volatile because housing demand is closely tied to local employment and affordability constraints. Rent levels are often well below those of Tier-1 peers, providing a larger buffer before demand softens. Cap rate expansion may occur, but it is often offset by steadier net operating income. The result is less dramatic drawdowns in asset-level cash flow, even if transaction liquidity temporarily slows.

    There is also a tendency to conflate liquidity with mark-to-market (adjusting values to reflect current market prices) visibility. Tier-1 markets benefit from frequent trades that allow values to reset quickly—up or down. In Tier-2 markets, pricing adjusts more slowly. This is sometimes framed as opacity. But it can also be viewed as insulation from short-term sentiment shifts. Fewer forced sellers and lower leverage levels among local owners can reduce the likelihood of sharp repricing during periods of stress.

    None of this implies that liquidity risk is irrelevant. Exit timing matters. Capital structures must be conservative. Business plans that depend on rapid appreciation or aggressive cap rate compression are poorly suited to smaller markets. But when underwriting aligns with the actual liquidity structure—regional buyers, income-oriented holds, and modest leverage—the risk profile is often more stable than institutional models assume.

    The persistence of this mispricing is not accidental. Standardized exit assumptions simplify portfolio construction and reporting. They also favor markets where institutional buyers set prices. Tier-2 Sun Belt cities challenge that framework. Their liquidity is different, not deficient. Treating it as inherently riskier reflects modeling convenience more than economic reality.

    Shoora Capital

    Shoora Ground Level

    Institutional-grade analysis on Sun Belt real estate, delivered directly to family offices and sophisticated investors. No noise. No marketing. Just the signals that matter — before they show up in the data.

    Sign up for Ground Level →

    Structural Biases: Reputation, Career Risk, and Fund Optics

    Beyond models and benchmarks, human incentives play a decisive role in shaping institutional allocation behavior. Even when data support investment in Tier-2 Sun Belt markets, decision-makers operate within reputational and career-risk frameworks that discourage deviation from consensus. These constraints are rarely acknowledged explicitly, but they are central to why underallocation persists.

    For institutional fund managers, market selection is not judged in isolation. It is evaluated relative to peers, benchmarks, and expectations set with limited partners. Investing in a Tier-1 market that underperforms is often rationalized as cyclical misfortune—interest rates moved, supply surged, or demand softened. The same outcome in a lesser-known market is more likely to be attributed to judgment. The distinction matters. One outcome is defensible. The other can derail careers.

    Investment committees amplify this dynamic. Proposals in familiar markets benefit from shared reference points. Committee members have seen similar deals before. Risks feel known, even when valuations are aggressive. In contrast, Tier-2 markets require explanation. Time must be spent justifying why the market “counts,” not merely why the deal works. That added burden raises the hurdle rate, regardless of fundamentals.

    Fund optics reinforce the bias. Large institutions report to limited partners (LPs) who expect recognizable exposure. Portfolio maps filled with major metros are easy to communicate and benchmark. Smaller cities raise questions. They may require additional narrative around liquidity, exit paths, and comparability. Even if returns are strong, the perceived complexity can be viewed as unnecessary friction in LP relations.

    There is also an asymmetry in accountability. Choosing a non-consensus market concentrates responsibility on the individual or small group that championed it. Choosing a consensus market diffuses responsibility across the industry. In environments where capital preservation and relative performance matter as much as absolute returns, diffusion of blame becomes a rational objective.

    None of this implies irrationality. These behaviors are consistent with incentive structures faced by professional managers overseeing large pools of third-party capital. The problem is that they skew outcomes. Markets that fall outside the institutional comfort zone must clear higher evidentiary and political hurdles, even when their operating characteristics are stable and their valuations conservative.

    Over time, these structural biases harden into norms. Tier-2 markets are avoided not because they have failed, but because backing them requires conviction without cover. Until incentive structures change, institutional capital will tend to favor reputational safety over incremental return. That preference helps explain why misallocation can persist even when fundamentals continue to strengthen.

    Capital Saturation in Tier-1 Markets (and Its Consequences)

    The concentration of institutional capital in Tier-1 Sun Belt markets has not been neutral. Over time, it has reshaped risk profiles in ways that are often underappreciated. What began as a preference for liquidity and scale has, in many cases, simply resulted in capital saturation — a condition where incremental dollars no longer improve risk-adjusted outcomes.

    Paradoxically, higher liquidity does not mean lower risk. It often means faster repricing and higher short-term volatility.

    Paradoxically, higher liquidity does not necessarily mean lower risk. It often means faster repricing and thus higher short-term volatility.

    In markets such as Dallas, Phoenix, Atlanta, and Austin, years of aggressive capital inflows have compressed yields to levels that leave little margin for error. Cap rates have reached effective floors, supported less by current income than by expectations of continued rent growth and exit liquidity. Underwriting increasingly depends on forward assumptions rather than in-place cash flow.

    As competition intensifies, acquisition pricing rises faster than operating fundamentals. Buyers accept thinner going-in yields, higher leverage, and narrower operating cushions to remain competitive. In this environment, rent growth does more than enhance returns; it becomes necessary to justify basis. When rent growth slows or supply outpaces demand, that dependency introduces fragility.

    Basis BasicsBasis is the investor’s all-in cost to acquire and capitalize a property, not just the purchase price. It includes closing costs, renovation capex, leasing costs, financing fees, and other upfront expenses.When pricing is high, the asset’s current income often can’t support that basis on its own. Future rent growth is then required to “grow into” the cost. If rent growth slows or supply increases, the basis becomes too heavy, compressing returns and increasing downside risk.

    Capital saturation also alters market dynamics during downturns. In highly institutionalized metros, ownership profiles skew toward leveraged, mark-to-market-sensitive investors. When conditions tighten, these markets can experience faster repricing because transactions occur frequently and sentiment shifts quickly. Liquidity, often cited as a risk mitigant, can accelerate downside as readily as upside.

    There is an additional, subtler effect. As Tier-1 markets become consensus “safe” allocations, risk is redefined rather than reduced. Valuation risk replaces operational risk. When assets are bought at very high prices (low cap rates), investor outcomes are driven more by shifts in exit pricing than by how well the property is actually operated. Investors are less exposed to local economic shocks, but more exposed to changes in capital markets assumptions, regarding factors such as interest rates, exit cap rates, and buyer appetite. These risks are highly correlated across institutions, reducing diversification benefits at the portfolio level.

    Meanwhile, Tier-2 markets are often penalized for lacking the very capital density that now amplifies risk in larger metros. Lower pricing competition translates into higher initial yields. Less speculative development reduces supply shocks. Ownership bases dominated by local and regional operators tend to be less levered and less reactive to short-term capital market volatility.

    In our assessment, the paradox is clear. The markets perceived as safest increasingly rely on optimistic assumptions to sustain returns. The markets perceived as riskier often offer wider margins of safety because capital has not crowded in. This does not imply that Tier-1 markets are unattractive or that Tier-2 markets are universally superior. It does suggest that capital concentration has consequences.

    When too much capital chases the same set of markets, risk does not disappear. It migrates from operating uncertainty to valuation sensitivity. Recognizing that shift is essential to understanding why institutional comfort and actual resilience are no longer perfectly aligned.

    What Institutions Are Missing in Tier-2 Sun Belt Cities

    The persistent underallocation to Tier-2 Sun Belt markets obscures a set of structural advantages that are difficult to access once institutional capital crowds in. These advantages are not speculative. They are rooted in demand formation (sources of new customers), supply dynamics, and the absence of capital saturation.

    Migration remains the most visible factor, but its composition matters more than its headline growth rate. Tier-2 metros such as Huntsville, Greenville, and Chattanooga tend to attract residents for employment rather than lifestyle arbitrage alone. Defense contractors, advanced manufacturing, healthcare systems, and logistics hubs anchor local labor markets. These sectors generate steady household formation and rental demand without the same sensitivity to venture funding cycles or financial market volatility. The Chattanooga metropolitan area, for example, grew at more than twice the national rate between 2020 and 2025, driven primarily by domestic in-migration from California and Illinois, according to research from the University of Tennessee at Chattanooga’s Center for Regional Economic Research. The Huntsville metro reached approximately 420,000 residents by 2025, reflecting consistent annual growth anchored by sustained defense and aerospace employment.

    Housing supply is the second, and often more important, factor. In many Tier-2 markets, new construction has lagged population growth for years, not quarters. Zoning constraints, limited institutional development capital, and smaller local builder ecosystems slow supply response. This does not eliminate cyclical risk, but it does reduce the likelihood of sudden oversupply. Rent growth in these environments is less about pushing pricing and more about closing long-standing gaps between demand and available stock.

    Capital structure dynamics further differentiate these markets. Lower institutional penetration means less aggressive underwriting. Deals are more likely to be priced on in-place cash flow rather than pro forma (projected) assumptions. Initial yields tend to be higher, not because risk is elevated, but because competition is thinner. That yield premium provides flexibility: supporting conservative leverage, longer holds, and resilience when exit timing shifts.

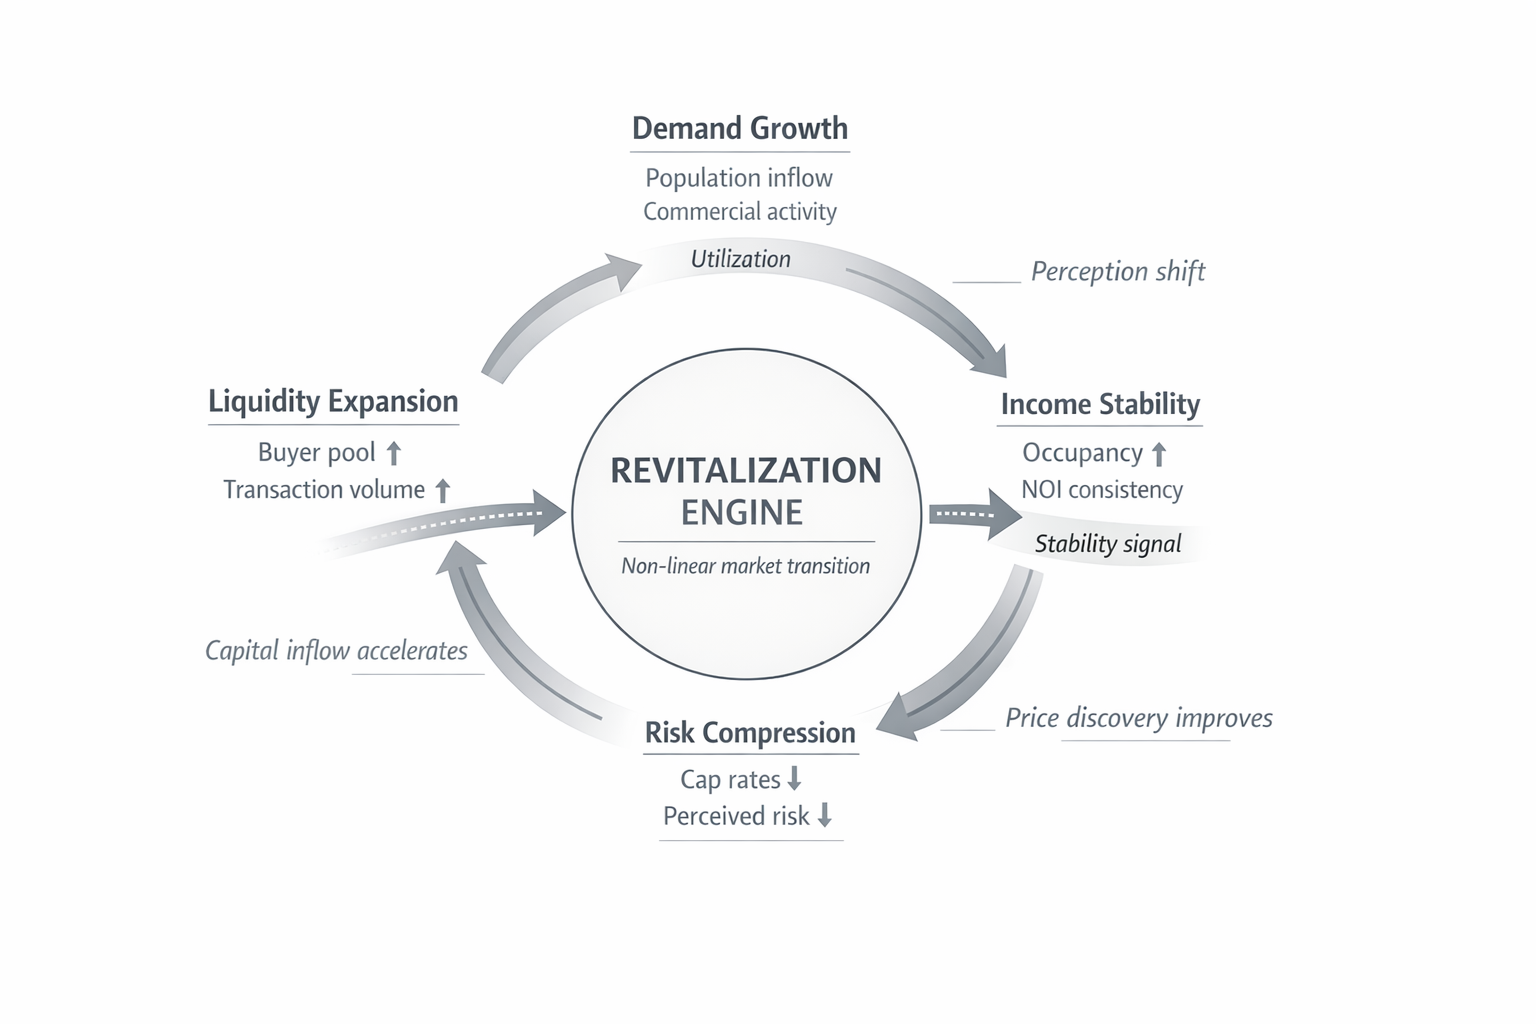
    Local economic “flywheels” amplify these effects. In several Tier-2 Sun Belt cities, manufacturing reshoring has increased demand for workforce housing near employment centers. Defense and aerospace spending introduces long-duration federal capital that is less cyclical than private investment. Healthcare and education expand alongside population growth, reinforcing employment stability. These dynamics compound over time, but they rarely appear in top-down allocation models focused on transaction volume or institutional buyer density.

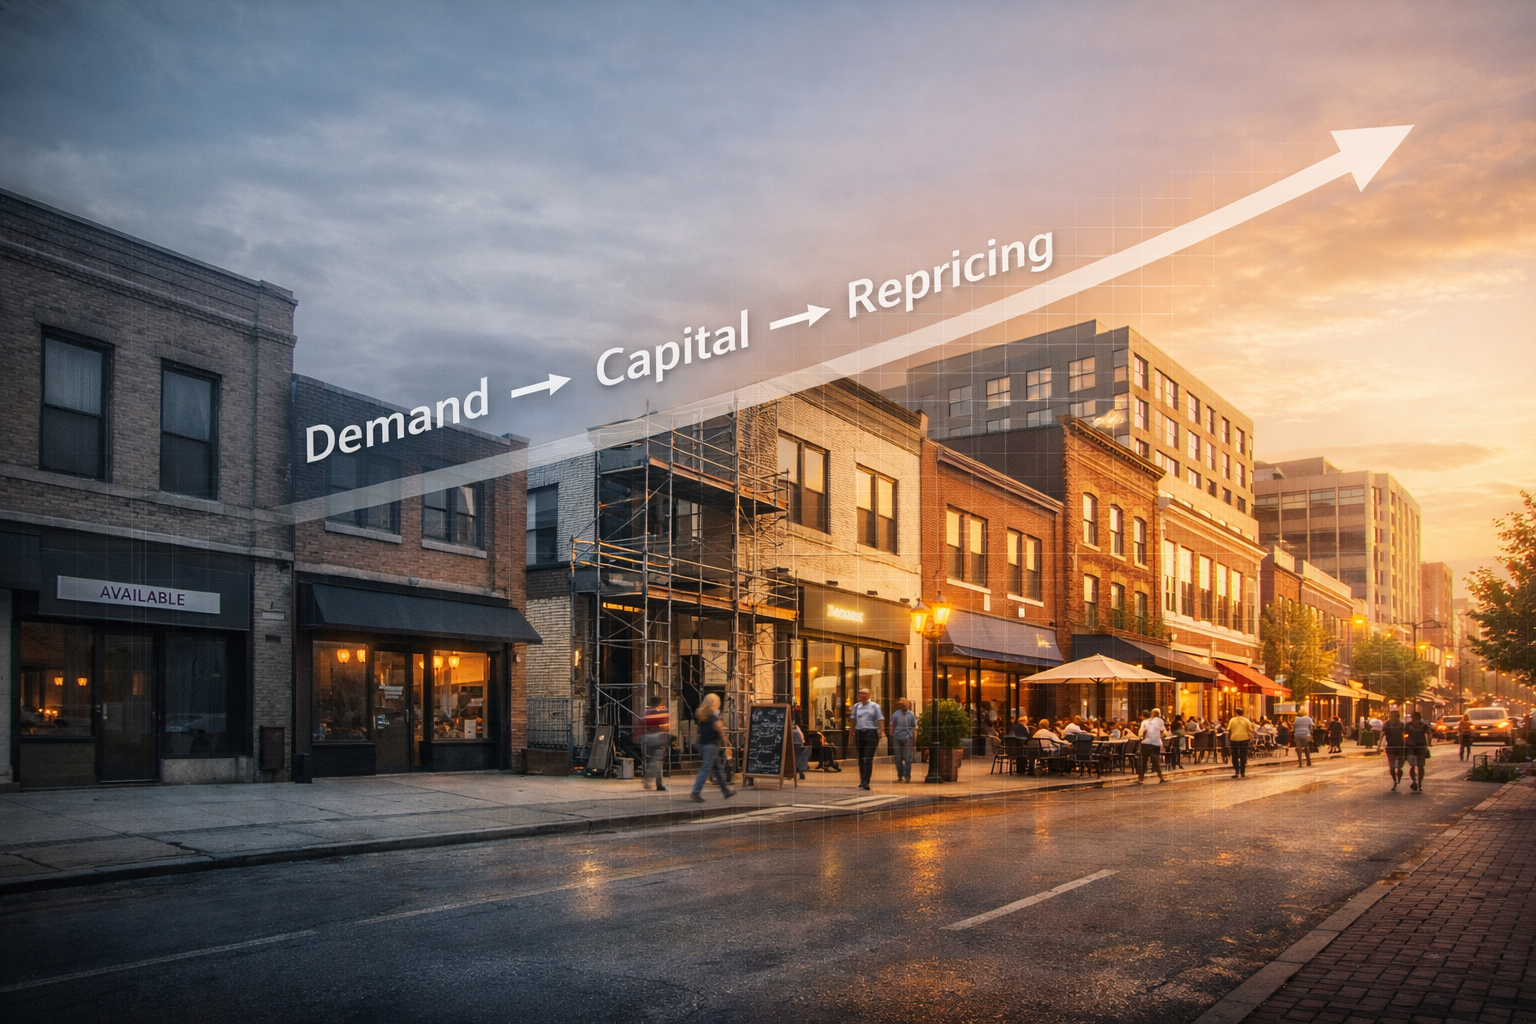
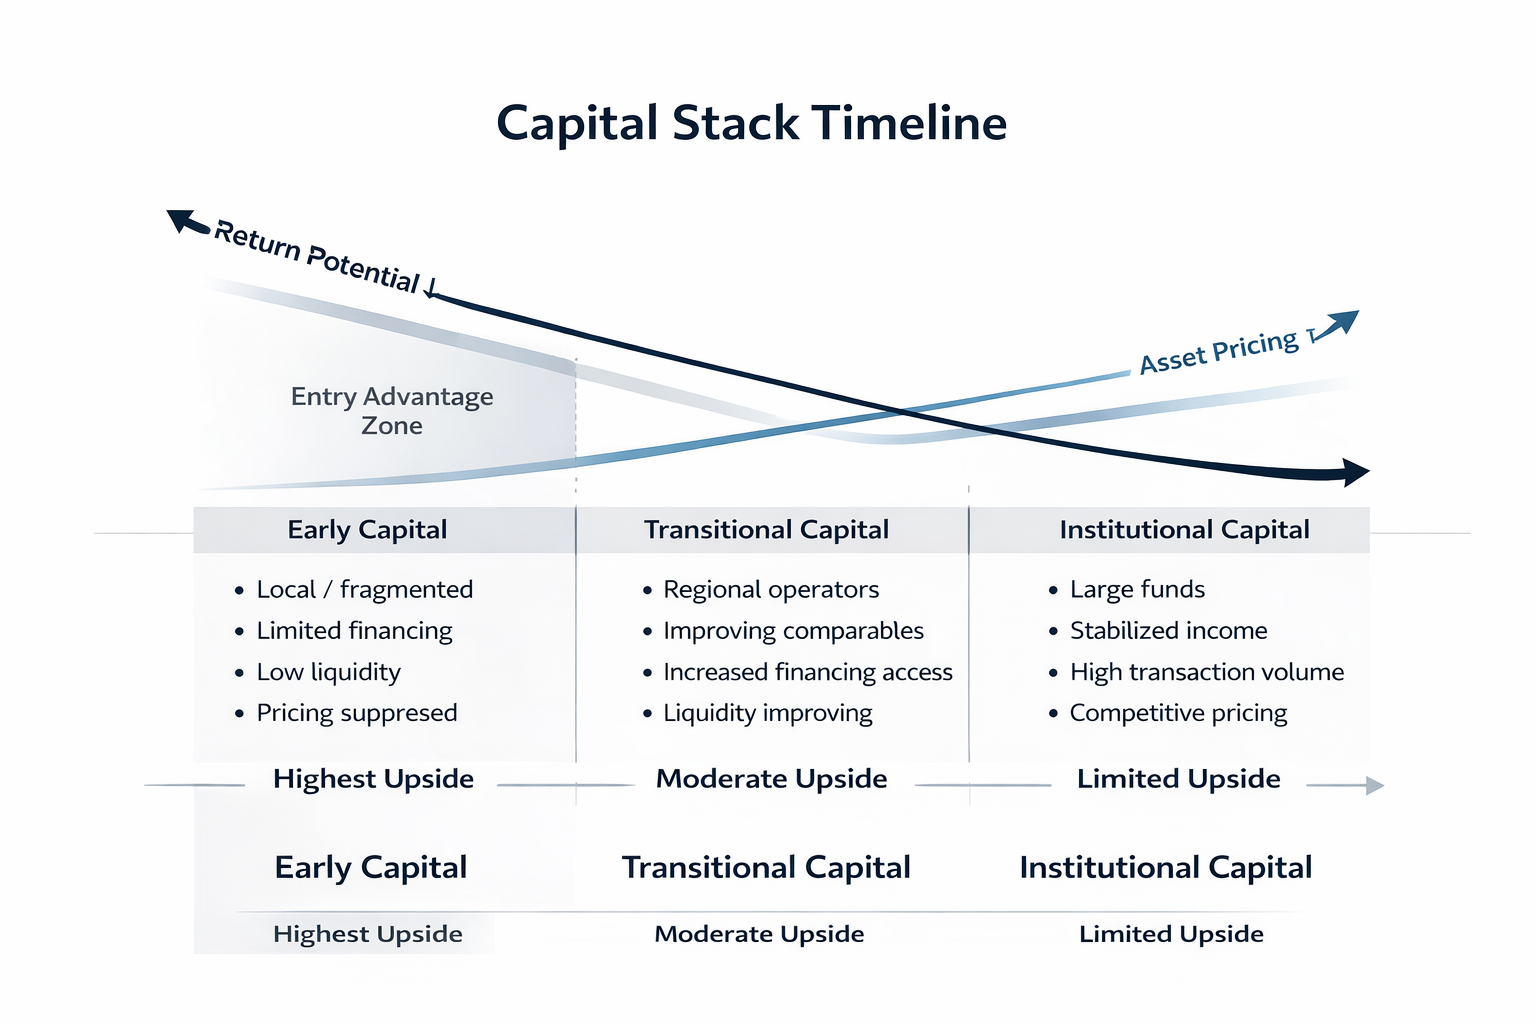
    Perhaps most critically, early capital captures inefficiency. When markets are lightly institutionalized, pricing reflects local constraints rather than national capital flows. Assets are acquired before yield compression and before development pipelines respond. Appreciation, where it occurs, is often scarcity-driven rather than sentiment-driven.

    Institutions are not missing these markets because they lack growth. They are missing them because the advantages accrue slowly, unevenly, and at scales that do not align with large fund mandates. For investors able to underwrite locally, operate patiently, and accept different liquidity profiles, Tier-2 Sun Belt cities offer something increasingly rare: growth supported by fundamentals, priced without consensus capital.

    Why This Misallocation Persists (and Won’t Self-Correct Soon)

    A common assumption is that capital eventually finds its way to better opportunities. If Tier-2 Sun Belt markets continue to grow, the thinking goes, institutional investors will adapt. In practice, the forces driving underallocation are not temporary frictions. They are embedded constraints, which makes correction difficult and unlikely.

    Fund size is the most immediate barrier. As institutional vehicles grow larger, flexibility declines. A $10 billion fund cannot meaningfully reorient toward smaller markets without changing its mandate, staffing model, and reporting framework. Even if leadership recognizes relative value in Tier-2 metros, deploying capital there at scale introduces operational complexity and tracking error that conflicts with fund design. Growth in assets under management makes going “down market” harder, not easier.

    Tracking error measures risk, not return: it captures how volatile a portfolio’s deviations from its benchmark are, regardless of whether those deviations are positive or negative.

    Mandates reinforce the same inertia. Many institutional funds are explicitly structured around liquidity, benchmark alignment, and market comparability. These are not preferences; they are contractual obligations set with limited partners. Adjusting them requires LP consent, revised benchmarks, and often multi-year transitions. As a result, even well-documented shifts in fundamentals may not translate into allocation changes within a fund’s lifespan.

    Research coverage lags reality as well. Third-party data providers, consultants, and index constructors respond to transaction activity, not leading indicators. Because Tier-2 markets transact less frequently, they generate fewer data points and receive less analytical attention. That absence of coverage then becomes justification for continued avoidance. Capital waits for data. Data waits for capital.

    Perhaps most importantly, new capital reinforces old flows. As long as Tier-1 markets remain the primary destination for institutional money, they will continue to dominate benchmarks, research agendas, and peer comparisons. Even when returns compress, relative performance frameworks reward staying close to consensus. Underperforming together is safer than outperforming alone.

    None of this implies that institutions are making irrational decisions. Within their constraints, the behavior is coherent. The problem is that those constraints are structural, not cyclical. They do not loosen simply because fundamentals improve elsewhere.

    For Tier-2 Sun Belt cities, this means underallocation is durable. It will not disappear after a few strong years of growth, nor will it correct quickly through arbitrage. The gap persists because the capital most capable of closing it is least able to move. In our view, that durability is precisely what makes the opportunity real — but only for investors who are not subject to institutional gravity.

    What This Means for Early Allocators and Specialized Operators

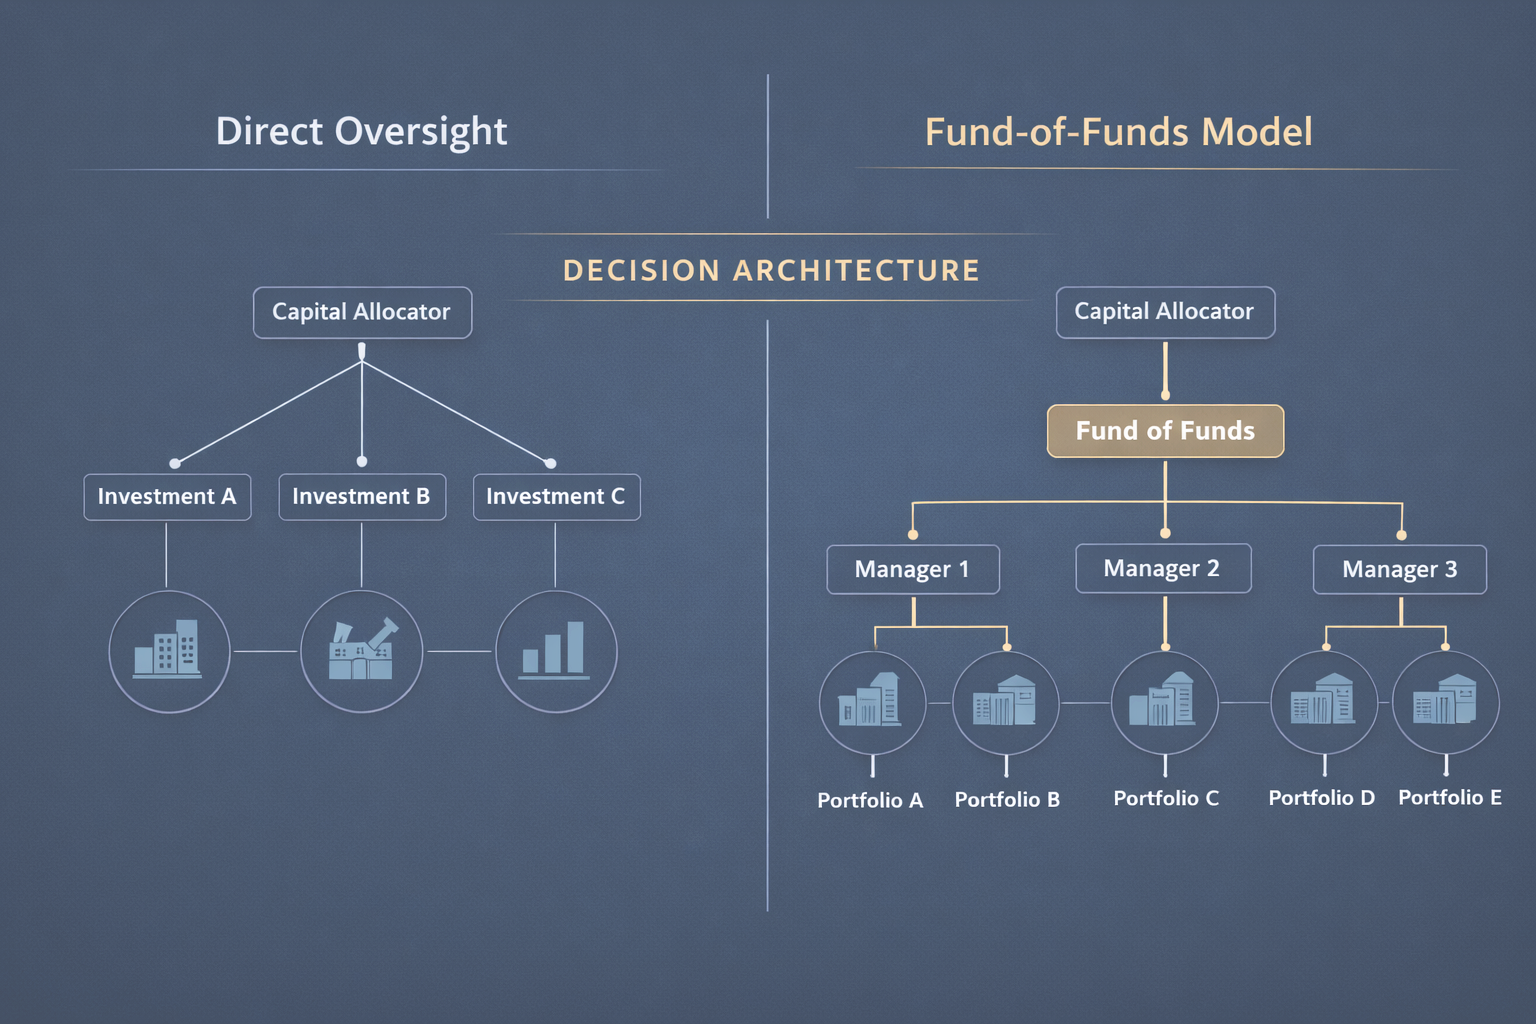
    The structural barriers that limit institutional participation in Tier-2 Sun Belt markets also define who is positioned to invest there effectively. This is not an opportunity for generalist capital or for strategies built around rapid deployment and short-duration holds. It favors investors with flexibility, both in mandate and mindset.

    Family offices are natural beneficiaries. With fewer reporting constraints and longer investment horizons, they can underwrite markets on operating fundamentals rather than benchmark fit. Smaller private equity funds face a similar advantage. Capital that can be deployed incrementally, across multiple assets, is better aligned with markets where deal sizes are modest and transaction velocity is slower. For these investors, the absence of institutional competition improves entry pricing and widens the margin of safety.

    Direct operators hold a further edge. In Tier-2 metros, local knowledge is not a nice-to-have; it is a primary driver of outcomes. Understanding employer dynamics, zoning nuances, and neighborhood-level demand matters more than macro forecasts. Operator-led platforms can adjust business plans, pacing, and leverage to local conditions in ways centralized capital often cannot. That adaptability reduces reliance on exit timing and enhances cash flow durability.

    The advantages compound over time. Lower basis allows for conservative capital structures. Less competitive bidding reduces the need for aggressive assumptions. Longer hold periods enable investors to benefit from organic rent growth and incremental scarcity rather than speculative appreciation. Returns are built through operations, not compression.

    Importantly, this is not a call to indiscriminately pursue smaller markets. Selectivity remains critical. Outcomes depend on employer concentration, housing elasticity, governance, and capital discipline. The point is narrower: investors not bound by institutional frameworks can access a segment of the Sun Belt where growth is real, capital is scarce, and pricing remains imperfect.

    For allocators willing to accept different liquidity profiles and invest with local precision, Tier-2 Sun Belt cities offer something increasingly uncommon. Not a shortcut to returns, but a structural advantage created by those who cannot participate.

    At Shoora Capital, this is the thesis we invest around — targeting Tier-2 Sun Belt markets where employment diversification, housing undersupply, and limited institutional presence create durable pricing advantages. Our broader perspective on why private real estate belongs in a sophisticated portfolio explains the foundational framework. For family offices focused on building generational wealth through real estate, our approach to Tier-2 Sun Belt markets offers exactly the kind of patient-capital structural advantage that larger institutional vehicles cannot access.

    In Conclusion: Structural Gaps, Not Market Inefficiency

    The persistent underallocation to Tier-2 Sun Belt cities is often framed as an inefficiency waiting to be arbitraged away. That framing misses the point. This is not a simple case of capital lagging data or investors overlooking growth. It is the logical outcome of how institutional real estate capital is structured, measured, and incentivized.

    Institutions prioritize scale, liquidity, benchmark alignment, and reputational safety. Those priorities are rational within their constraints. They also systematically favor large, highly trafficked markets, regardless of whether marginal fundamentals justify continued concentration. Tier-2 Sun Belt markets fall outside those constraints, not because they lack qualifying metrics, but because they do not fit the operating requirements of large pools of capital.

    As a result, misallocation persists even as fundamentals strengthen. Population growth, employment expansion, and housing undersupply alone are insufficient to redirect institutional flows. Without benchmark representation, deep transaction volume, and consensus validation, these markets remain structurally sidelined. That condition is unlikely to change quickly, if at all.

    For investors evaluating this landscape, the implication is not that Tier-2 markets are universally superior or risk-free. They are heterogeneous. Outcomes depend on local economies, supply discipline, governance, and underwriting rigor. The advantage lies elsewhere. It lies in recognizing that institutional absence is not a temporary anomaly, but a durable feature of the capital markets.

    That durability creates room for disciplined, patient capital to operate without crowding. It allows returns to be built through income and scarcity rather than leverage and compression. And it rewards investors who can underwrite markets as they are, not as benchmarks require them to be.

    In that sense, Tier-2 Sun Belt cities do not represent a bet against institutions. They represent an investment strategy orthogonal to them, one that accepts different liquidity profiles in exchange for pricing discipline and fundamental support. The opportunity is not created by market inefficiency alone, but by structural limits on who can participate.

    Disclaimer: This article is provided for educational purposes only and does not constitute investment advice. Real estate investing involves risk, including the possible loss of capital, and outcomes vary by investor and circumstance. Past performance does not guarantee future results. Readers should consult qualified financial, legal, and tax advisers before acting on any information discussed.

    Frequently Asked Questions

    What is a Tier-2 Sun Belt market?

    A Tier-2 Sun Belt market is a secondary metropolitan area — typically with a population of 200,000 to 1 million — that sits below the major institutional markets (Dallas, Phoenix, Atlanta, Austin) in scale and benchmark representation, but often above them in relative growth rates. These cities tend to have two to four anchor industries, such as defense, manufacturing, healthcare, or logistics, providing employment stability without dependence on a single dominant sector.

    Why doesn’t institutional capital flow to Tier-2 markets even when fundamentals are strong?

    Institutional capital is constrained by fund mandates, benchmark alignment requirements, minimum deal sizes, and career-risk incentives that all favor large, liquid, consensus markets. These constraints operate before qualitative analysis begins — many Tier-2 markets fail liquidity thresholds or minimum transaction volume screens automatically. The result is exclusion before judgment, not rejection after it.

    Are Tier-2 Sun Belt markets riskier than Tier-1 markets?

    Not inherently. Tier-2 markets carry different risk — primarily around liquidity and exit timing — rather than higher fundamental risk. Meanwhile, capital saturation in Tier-1 markets has shifted their risk profile from operations to valuation: investors in those markets are now more exposed to changes in exit capitalization rates and capital market assumptions than to how the properties actually perform. Tier-2 markets often provide wider initial yields and steadier operating income, which creates a different but not necessarily inferior risk profile.

    Who is best positioned to invest in Tier-2 Sun Belt real estate?

    Family offices, smaller private equity funds, and direct operators with local market knowledge are best positioned. These investors can underwrite on operating fundamentals rather than benchmark fit, accept longer hold periods, and work with regional buyer pools at exit. The absence of institutional competition reduces acquisition pressure and supports more conservative capital structures — advantages that compound over time.

    Will institutional capital eventually close the allocation gap in Tier-2 markets?

    Unlikely in the near term. The barriers are structural, not cyclical. Fund mandates, LP reporting expectations, benchmark construction, and assets under management scale requirements create durable constraints that do not loosen simply because fundamentals improve elsewhere. Until those constraints change — which requires LP consent, mandate revision, and multi-year transitions — institutional capital will remain concentrated in familiar markets regardless of where relative value actually sits.

    Disclaimer: This article is provided for educational purposes only and does not constitute investment advice. Real estate investing involves risk, including the possible loss of capital, and outcomes vary by investor and circumstance. Readers should consult qualified financial, legal, and tax advisers before acting on any information discussed.

    Why Private Real Estate? Returns, Income & Diversification

    Key Takeaways

    • Private real estate investments have historically delivered competitive long-term returns with lower reported volatility than public REITs over certain multi-decade periods, e.g., 2000–2020.
    • It has demonstrated low correlation to public equities and bonds, improving portfolio diversification.
    • Income returns have historically represented a significant portion of total return, supporting cash-flow stability.
    • Institutional investors commonly maintain 10–15% strategic allocations to real estate.
    • Access to private markets remains essential for meaningful exposure, as the majority of commercial real estate is privately owned.

    When building enduring, multigenerational wealth, sophisticated investors and family offices increasingly ask: why invest in private real estate? The answer lies in a compelling risk-return profile and powerful diversification benefits. Indeed, over certain time frames, private real estate has delivered equity-like returns but with far less volatility, according to the National Council of Real Estate Investment Fiduciaries (NCREIF).

    In this article, we will examine the fundamental case for private real estate as a vehicle for long-term capital preservation and growth. We will also explore why many large institutions and family offices maintain a 10–20% allocation to private real estate across economic cycles.

    By the end, you’ll understand why private real estate remains a cornerstone for those seeking wealth that endures, across generations.

    Real Estate: The Third-Largest Asset Class

    Real estate, particularly commercial real estate, occupies a place among the giants of investable asset classes, offering investors a compelling hybrid of income and long-term capital appreciation. Private real estate generates steady rental income, while properties often appreciate over time, combining the cash-flow benefits of fixed income with the growth potential of equities.

    To appreciate its scale: at year-end 2024, the U.S. fixed income market totaled approximately $46.9 trillion in outstanding securities (SIFMA). By comparison, the estimated value of the U.S. commercial real estate (CRE) market — across office, industrial, retail, multifamily, hospitality, and other property types — was roughly $26.8 trillion (The Real Estate Roundtable, 2024). Meanwhile, the U.S. public equity market stood at approximately $62.2 trillion in total market capitalization at year-end 2024 (Siblis Research).

    Figure 1: U.S. Financial Markets year-end 2024 — CRE at $26.8T (19.7%), fixed income at $46.9T (34.5%), public equity at $62.2T (45.8%)

    Data Sources: SIFMA; Real Estate Roundtable; Siblis Research

    These figures show that commercial real estate represents a massive, systemic asset class, not a niche “alternative,” but a core component of the investable universe alongside bonds and stocks. That scale underscores real estate’s fundamental economic role: it is indispensable infrastructure for business, housing, commerce, and more, supporting the flow of goods and services, employment, and long-term growth.

    For sophisticated investors and family offices seeking lasting wealth, real estate offers a large, liquid (on a market-wide basis), and economically grounded allocation option, capable of delivering both stable cash flow and long-term capital appreciation.

    Private Markets: The Primary Way to Invest

    For investors seeking meaningful exposure to real estate, private markets, not public NAREIT-listed REITs, remain the dominant arena. Indeed, with 89% of U.S. commercial real estate privately owned (Q4, 2024), private real estate defines the core investable universe.

    A commonly cited rule of thumb is an 85/15 split: roughly 85% of commercial real estate sits in private hands, while only about 15% is represented by public REITs. This estimate is supported by NAREIT research.

    This split matters a great deal. On one hand, it underscores the reach and depth of opportunity available, far beyond what public markets can touch. On the other hand, it presents a challenge: without access to private funds or direct deals, even large investors may be locked out of much of the real estate opportunity set.

    Private markets offer a far broader universe of property types (office, industrial, hospitality, multifamily, niche assets), geographies (core, secondary, tertiary markets), and strategies (core income, value-add, opportunistic, development) than public REITs typically provide. For family offices and long-term investors, accessing private markets is thus essential for building a comprehensive, diversified real estate allocation, one capable of capturing both income and appreciation across economic cycles.

    In short: public REITs are only the “tip of the iceberg.” To secure meaningful exposure, and harness real estate’s full risk-return potential, participating in the private markets is more than a preference; it’s a necessity.

    Individual Investors Are Significantly Under-allocated

    Despite real estate’s scale and its role as a major institutional asset class, individual investors remain markedly under-allocated. Major institutions such as public pensions and university endowments typically commit about 10-15% of their portfolios to real estate and real-asset strategies, reflecting a long-standing recognition of the asset class’s income stability, inflation protection, and diversification value.

    Family offices show a similar posture: recent studies place their real-estate allocation at around 11%, with 2025 surveys from Goldman Sachs, indicating a rebound in allocations as families re-engage private markets following recent volatility.

    Individual investors, by contrast, remain dramatically behind. Industry research shows that most allocate under 5% to alternatives overall, which includes private real estate, private equity, private credit, and hedge funds combined. This gap is not the result of weaker demand, but of historical access constraints, minimum investment thresholds, accreditation rules, limited product availability, and operational complexity that once made private real estate difficult for individuals to enter.

    The barriers traditionally faced by the individual investor are now rapidly falling. Modern private-market vehicles offer lower minimums, simplified structures, improved transparency, and institutional-grade management. As a result, individual investors are beginning to close the gap. The appetite for alternatives, including real estate, is growing, as a recent survey from Blackrock indicates. Seventy-two (72%) of respondents are prepared to invest in private markets.

    However, the allocation discrepancy remains large, highlighting a significant opportunity for those seeking to build resilient, multi-generational portfolios grounded in the same principles that guide leading institutions.

    Attractive Risk-Adjusted Returns

    Private real estate has historically delivered a compelling blend of strong returns and lower volatility, depending on the benchmark and measurement period. This has produced some of the most attractive risk-adjusted outcomes among major asset classes.

    Over the 20-year period ending December 31, 2020, the NFI-ODCE Index, the industry’s flagship benchmark for core private real estate, has generated 8.1% annualized returns. This places it within striking distance of the S&P 500’s roughly 12% annualized total return, based on Slickcharts data.

    Where private real estate truly differentiates itself is volatility. “Private real estate volatility has been significantly lower than listed REITs and other stock categories, producing a record of higher risk-adjusted returns,” states a TIAA report. By virtue of their public market inclusion, listed REITs are affected by overall market volatility.

    Figure 2: Return distribution 2000–2020 — Public REITs (σ=21.6%) versus Private Real Estate (σ=8.4%), showing materially lower volatility for private real estate

    Data Source: TIAA

    The chart compares the dispersion of annual returns for Public REITs and Private Real Estate from 2000–2020 by plotting normal distributions using their historical mean returns and standard deviations, as supplied by this TIAA Report. Although average returns were close (10.7% for REITs versus 8.1% for private real estate), the width of the distributions differs materially.

    Public REITs exhibit a much wider spread (σ = 21.6%), indicating significantly greater year-to-year volatility, while private real estate shows a tighter clustering of outcomes (σ = 8.4%). The shaded ±1σ regions illustrate the range within which approximately 68% of annual returns would be expected to fall, highlighting that REIT returns fluctuated over a range roughly 2.6 times wider than private real estate over the period.

    The report compared the NCREIF Fund Index–Open End Diversified Core Equity (NFI–ODCE) for private real estate and FTSE NAREIT U.S. Real Estate Index for listed REITs.

    The resulting Sharpe ratios, a measure of risk-adjusted performance, for the twenty-year period January 1, 2000 to December 31, 2020 illustrate the differences: 0.43 for public REITs; 0.78 for private real estate.

    Thus, while public REITs did produce higher returns (10.7%) than private real estate (8.1%) over the sample period (January 1, 2000-December 31, 2020), the return patterns differed meaningfully due to structural characteristics of each vehicle.

    However, note that public REITs are exchange-listed securities and therefore trade continuously. Their prices adjust in real time to changes in interest rates, equity risk premiums, investor sentiment, and broader macroeconomic conditions. As a result, listed REIT volatility often resembles that of small- and mid-cap equities, reflecting daily liquidity and mark-to-market pricing rather than solely underlying property-level cash flows.

    Private real estate, by contrast, reflects the performance of directly held properties. Valuations are typically based on periodic third-party appraisals and transaction comparables rather than continuous market trading. Returns are therefore driven primarily by net operating income, rent growth, occupancy trends, financing structure, and property-level appreciation. This appraisal-based framework produces smoother reported volatility, though it may also delay the recognition of rapid market repricing.

    The observed difference in volatility between public REITs and private real estate over the sample period reflects these structural distinctions: one is a liquid, publicly traded equity vehicle; the other is an appraisal-based ownership structure tied more directly to property cash flows. Each serves a distinct role within a portfolio depending on an investor’s objectives for liquidity, transparency, income stability, and sensitivity to public-market movements.

    Importantly, outcomes can vary meaningfully across time horizons and market regimes. The comparison between public REITs and private real estate highlights differences in structure and pricing behavior rather than an inherent advantage of one format over the other.

    Regardless, private real estate’s blend of competitive returns, moderate volatility, and strong Sharpe ratios makes it a compelling choice for investors focused on durable, risk-adjusted wealth creation.

    Shoora Capital

    Shoora Ground Level

    Institutional-grade analysis on Sun Belt real estate, delivered directly to family offices and sophisticated investors. No noise. No marketing. Just the signals that matter — before they show up in the data.

    Sign up for Ground Level →

    Low Correlation: Meaningful Portfolio Diversification

    One of private real estate’s most powerful advantages is its consistently low correlation to traditional asset classes. Over the 20 years ending December 2020, the NFI-ODCE Index showed a correlation of just 0.14 with the S&P 500, meaning private real estate often moves independently of, or even counter to, public equities. Correlations with fixed income are even better (-0.12). A portfolio mix of bonds and private real estate is a well-diversified portfolio.

    Figure 3: Correlation matrix — Private Real Estate shows low correlation to equities (0.14) and negative correlation to bonds (−0.12), demonstrating diversification benefits

    Data Source: TIAA whitepaper, Private Real Estate

    To put these numbers in context, correlation coefficients range from –1.0 (assets move in opposite directions) to +1.0 (assets move together perfectly). A correlation below 0.70 is widely accepted as providing meaningful diversification, improving a portfolio’s efficiency by reducing volatility without necessarily sacrificing returns.

    Private real estate has demonstrated this diversifying power through multiple market shocks. During the 2000–2002 Dot-Com Crash, private real estate delivered positive income as equities fell sharply. In the 2008–2009 Global Financial Crisis, it declined but far less dramatically than public markets. And during the 2022–2023 rate shock, appraisal-based valuations helped cushion volatility while public equities and bonds experienced sharp drawdowns.

    For investors seeking smoother return streams, reduced portfolio volatility, and better long-term compounding, private real estate’s low correlations make it an essential and stabilizing allocation.

    Consistent Income Distribution

    A defining characteristic of private real estate is its ability to generate steady, predictable income across cycles. Over the 20-year period from 2000 to 2020, NCREIF’s equity fund NFI-ODCE Index delivered an average annual total return of 8.1%, with volatility materially lower than equity dividends. A subsequent report puts that figure at 8.2%.

    Figure 4: NFI-ODCE return breakdown — income 5.5% (67.1% of total return) and appreciation 2.7% (32.9%), highlighting income-driven nature of private real estate returns

    Source: Florida State Board of Administration

    About two-thirds (5.5%) of that return is due to income, with appreciation accounting for (one-third) 2.7%.

    Importantly, income growth over this period has generally tracked or exceeded inflation, supported by steady increases in net operating income (NOI).

    This stability is rooted in real estate’s structural features. Long-term leases, typically running 3–10 years, provide durable cash flows. Contractual rent escalations, often tied to CPI or fixed annual bumps, help maintain real income in inflationary environments. Triple-net lease structures, which shift operating costs to tenants, further strengthen predictability. Meanwhile, broad geographic and tenant diversification reduces reliance on any single industry or market.

    Unlike dividends, which corporations can reduce or suspend during downturns, rental obligations persist contractually, providing a more resilient income stream. This is especially valuable during periods of market stress.

    For family offices and long-horizon investors seeking stable cash flow with inflation protection, private real estate’s consistent income distribution is a foundational pillar of its appeal.

    Potential Inflation Hedge

    Private real estate has long been viewed as a potential hedge against inflation, and the historical data supports this perception.

    NCREIF data show that commercial real estate NOI growth has been positively related to inflation over multiple decades, with one study finding a correlation of roughly 0.5 between NPI NOI growth and CPI from 1978–2011. More recent work from Goldman Sachs notes that NPI Net Operating Income (NOI) has consistently outpaced inflation over the long term, underscoring private real estate’s role as an income-based inflation hedge.

    Several mechanisms explain this inflation-responsive behavior. Contractual rent escalations, often tied to CPI or fixed annual increases, help maintain purchasing power during inflationary periods. When leases expire, market rent resets allow landlords to capture prevailing rental rates, a critical feature in fast-rising environments.

    Operating expense pass-throughs shift costs such as taxes, insurance, and utilities to tenants, preserving margins. Meanwhile, rising replacement costs for construction and materials provide valuation support, reinforcing the economic rationale for higher rents. Lastly, as real assets, properties benefit from the intrinsic value of land and physical structures, which tend to appreciate alongside general price levels.

    It is important to note, however, that real estate is not a perfect or immediate inflation hedge. Longer leases can introduce lag effects before rents adjust to new price conditions. With inflation still running above the Federal Reserve’s 2% target in 2026, the role of private real estate as a long-term inflation hedge remains especially relevant for investors seeking durable, purchasing-power-protected returns.

    The Shoora Capital Approach

    Shoora Capital brings an institutional mindset to the middle market while preserving the agility and accountability of a principal-led investment firm. Our approach is built on serving as a bridge between high-quality local operators and sophisticated investors, creating aligned partnerships that unlock opportunities often overlooked by large institutions.

    By investing our own capital alongside clients, we maintain direct accountability, reinforcing disciplined underwriting and long-term value creation. Central to that discipline is strict basis control at entry and conservative leverage designed to preserve downside protection before upside optimization.

    Shoora Capital sources transactions primarily through established operator relationships within targeted Sunbelt submarkets, supplemented selectively by brokered processes where recapitalizations, estate-driven sales, or capital stack resets create pricing inefficiencies.

    A meaningful portion of deal flow comes from repeat sponsors operating within defined geographic niches, allowing for information continuity, operating transparency, and faster underwriting cycles. We avoid broadly intermediated auctions where pricing is driven primarily by leverage expansion or cap rate compression assumptions.

    Underwriting discipline is structured around defined guardrails. Target loan-to-value ratios typically range between 55% and 65%, with stressed debt service coverage ratios modeled at or above 1.30x under downside rent and occupancy scenarios. Exit cap rates are underwritten with expansion of 50–100 basis points relative to entry assumptions, depending on asset class and submarket liquidity.

    Rent growth projections are based on trailing 10-year submarket averages rather than peak-cycle comparables. Capital expenditure scopes are fully defined at acquisition, with contingency reserves generally ranging from 5–10% of planned project costs. We underwrite for durability: stabilized yield on cost, DSCR resilience under rate expansion, and refinancing feasibility without relying on aggressive valuation assumptions.

    Post-acquisition, value creation is operational and measurable. Revenue management focuses on mark-to-market leasing, unit renovation programs supported by rent elasticity analysis, and ancillary income optimization where tenant demand supports it. Expense management includes vendor contract renegotiation, property tax appeal strategies, insurance restructuring where appropriate, and utility efficiency initiatives.

    Capital improvements are phased and tied to defined return thresholds rather than cosmetic repositioning. Asset-level reporting tracks NOI margins, rent spreads, leasing velocity, and budget variance monthly. Financing strategy prioritizes duration alignment and interest rate risk management. Projected returns are not dependent on cap rate compression at exit.

    Conclusion

    Private real estate offers a rare combination of characteristics that make it a cornerstone of long-term, multi-asset portfolios. Over certain historical periods, private real estate has delivered competitive returns with lower reported volatility than many public market real estate benchmarks. With low correlations to equities and fixed income, private real estate enhances overall portfolio diversification and helps smooth return patterns when public markets become volatile.

    Its consistent income generation, supported by durable leases and diversified tenant bases, provides a reliable source of cash-flow, while its sensitivity to inflation enables real estate to help preserve purchasing power over time. Underpinning all of this is the security of a tangible, productive asset, viz. land and buildings that serve essential economic functions.

    These strengths explain why leading institutions, pensions, endowments, and sovereign wealth funds have long maintained 10–15% strategic allocations to private real estate. Yet family offices and individual investors remain significantly under-allocated, often holding less than a quarter of the exposure found in institutional portfolios.

    If you are evaluating a strategic allocation to private real estate, we invite you to review our current investment themes and underwriting framework. Request the investor deck or speak directly with our team to discuss how disciplined basis selection and conservative leverage are applied in today’s market environment.

    Frequently Asked Questions

    How liquid is private real estate?

    Private real estate is generally considered a long-term, illiquid investment. Unlike publicly traded REITs, interests in private funds or direct properties are not bought and sold daily on an exchange. Liquidity, if available, is typically governed by fund structures, redemption windows, or asset sale timelines. Investors should be prepared to commit capital for multiple years.

    How are private real estate valuations determined?

    Valuations are typically based on periodic third-party appraisals, comparable transactions, and discounted cash flow analysis rather than continuous market pricing. This appraisal-based framework can produce smoother reported returns but may introduce timing lags during periods of rapid market repricing.

    What is the typical investment timeline?

    Private real estate investments commonly operate on a 3–7 year hold period, depending on strategy (core, value-add, opportunistic, or development). Core strategies often emphasize long-term income stability, while value-add and opportunistic strategies may target defined operational or repositioning timelines before exit.

    Who is private real estate generally suited for?

    Private real estate is typically appropriate for investors with a long-term investment horizon, tolerance for limited liquidity, and a desire for income generation and portfolio diversification. It is often utilized by pensions, endowments, family offices, and accredited investors seeking durable, risk-adjusted returns.

    How does private real estate fit within a broader portfolio?

    Institutions frequently maintain a 10–15% strategic allocation to real estate as part of a diversified multi-asset portfolio. Private real estate may enhance diversification due to historically low correlations with equities and bonds, while also contributing contractual income that can support portfolio stability across market cycles. Disclaimer: This content is for educational and informational purposes only and should not be construed as investment advice. Real estate investments involve risk, including potential loss of principal. Past performance does not guarantee future results. Consult with qualified financial, legal, and tax professionals before making investment decisions.